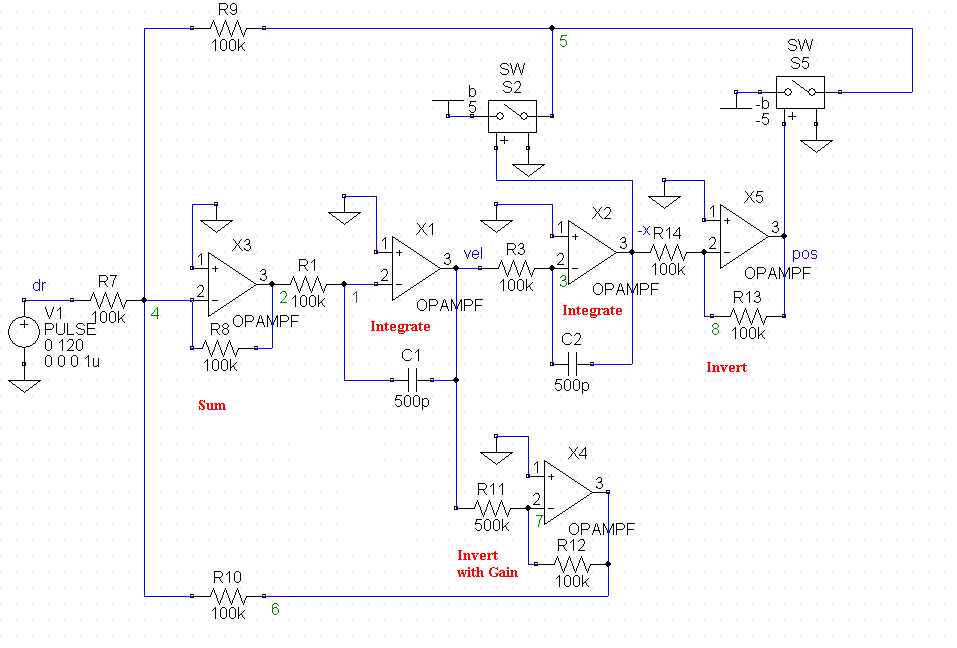
Figure 1. Schematic for the analog computer simulation of the driven constant-force magnitude oscilator.
Unlike the simplest (Hooke's law spring) oscillator, where the restoring force is in magnitude proportional to the displacement; the yo-yo oscillator has a constant force-magnitude. In other words, its potential energy function is linear, as contrasted to the quadratic (harmonic) potential of the simple harmonic oscillator. The linear potential is responsible for a nonlinear equation of motion which yields many surprising solutions. Rich in complexity, these solutions are in some cases chaotic. Numerical solutions to the equation of motion are presently obtained using the 'simulation program for integrated circuit engineering' (Spice). The circuit employed involves operational amplifiers and solid state switches.
BACKGROUND
The constant-force magnitude oscillator yields surprisingly diverse solutions even though its equation of motion is deceptively simple in appearance. In the previous modelling of this nonlinear system, both the elastic component and the damping component were chosen to be nonlinear by way of the signum function [1]. For the present work, the damping term is chosen to be linear (viscous). A previous study by the author has shown that only the fundamental Fourier component of the damping is important in determining the Q (large) of an oscillator of elastic-linear type [2]. It was thus assumed that little would be lost by letting the damping be linear; in so doing the number of required solid state switches is cut in half.
The equation of motion as presently treated is given by
| (1) |
where a and b are both constants, and the drive acceleration takes on various forms, such as sinusoidal or pulse form. In the schematic of figure 1, the drive is a 1 microsecond (very short) pulse so that the output position (`pos' as a voltage) would correspond to the `Green's function' response of the oscillator if it were a linear system. (It should be noted that the Green's function technique is not possible for a nonlinear system).

Figure 1. Schematic for the analog computer simulation of the
driven constant-force magnitude oscilator.
The simulation corresponds to an analog computer based on operational amplifiers, of which there are five in number. Two of these (X1 and X2) are configured as integrators with a time constant of 50 ms (R = 100 K ohms and C = 500 pF). The other two amplifiers are inverters, one of which (X4) is used to change the gain and thus the size of the damping constant a. Observe that the velocity dx/dt, once multiplied by this gain term, is fed back to the sum amplifier X3. The summer also is also being fed (i) the drive (a pulse in figure 1), and (ii) the output from two solid state switches. The inverter X5 is necessary to emulate sgn(x) in the equation of motion, as follows: Each of the solid state switch pair conducts (on state) when the input to the gate labeled with a plus sign is positive, and is cutoff when this gate signal is negative. By applying x and -x to the gates, the x-signal of variable magnitude is converted to a square wave of constant amplitude. This square wave corresponds to the constant-force magnitude restoration.
The response of the oscillator to a pulse, as shown in figure 2, yields insight into the system's behavior.
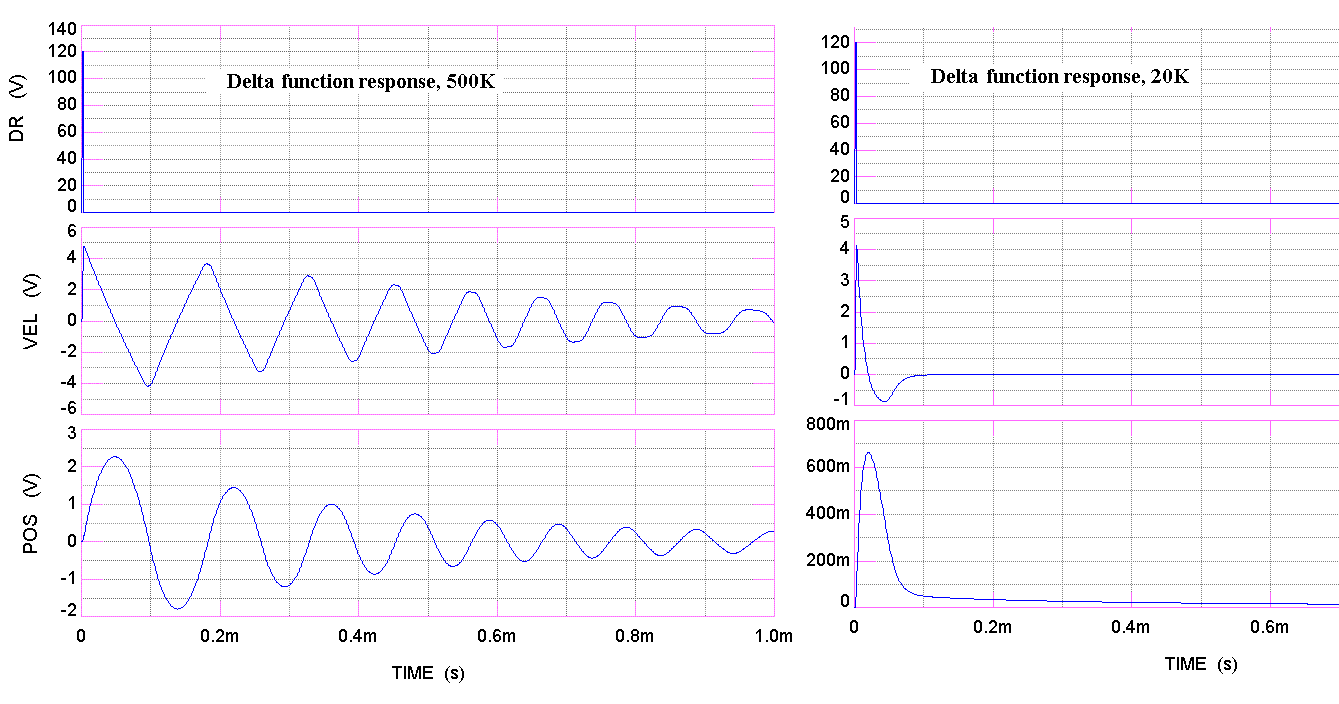
Figure 2. Response of the oscillator to a `delta function' drive.
The two cases correspond to different values of the damping coefficient a.
The two cases shown differ in terms of the damping coefficient a. For the case labeled 500K, the gain of X4 is 0.2, whereas for case 20K it is 5.0. It is seen that for the latter case the damping is too large to allow free-decay oscillation. In this regard it is somewhat like the overdamped simple harmonic oscillator, but we shall see that the frequency response is significantly different.
A dramatic difference from the harmonic oscillator is seen for the 500K case. Notice that the velocity is, for the first few cycles, approximately a triangular wave. This is easily understood for the idealized equation (1) because the integral of a constant (the force term) gives a straight line. The nearly straight line segments cannot join discontinuously because the performance of the opamps begins to significantly degrade with increasing frequency not far above 3.2 kHz = 1/(2p RC) for the values of R and C indicated in figure 1. Additional non-ideal features of the quasi-real electronics involve the switches. They do not turn on and off without hysteresis, and thus at low amplitudes the velocity begins to look more harmonic than triangular. When the velocity waveform is triangular, then the position corresponds to concatenated parabolas, smoothly joined at points where the slope of the velocity changes.
A hallmark of the yo-yo oscillator is clearly evident in the left graph of figure 1-the period is amplitude dependent, unlike the harmonic oscillator, which is isochronous.
STEADY STATE MOTION
When the drive signal is harmonic, the oscillator can for some frequencies entrain with the drive, as shown in figure 3.
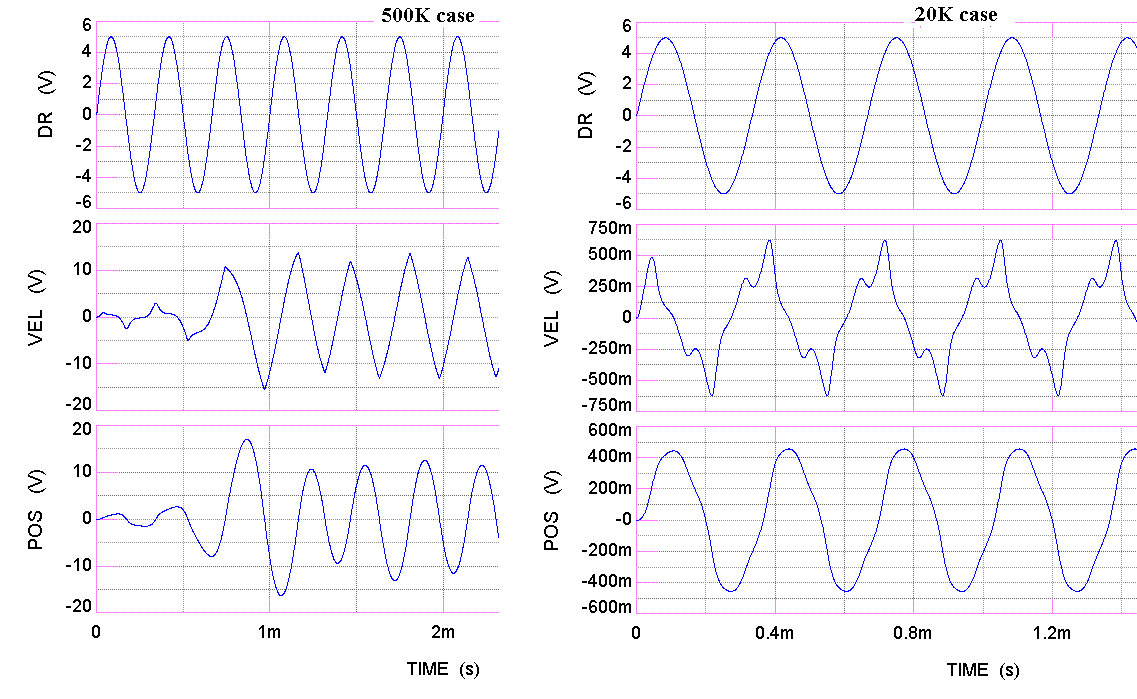
Figure 3. Examples of steady state response to a sinusoidal drive,
for two different damping cases. The drive frequency was in both
cases 3.0 kHz.
The left graph of figure 3 is seen (approaching steady state) to be nearly the triangular velocity waveform mentioned earlier. When the damping is large as in the right graph; although the motion is periodic with a fundamental at 3 kHz, there is compicated harmonic distortion. The distortion is readily seen in the spectra of figure 4.
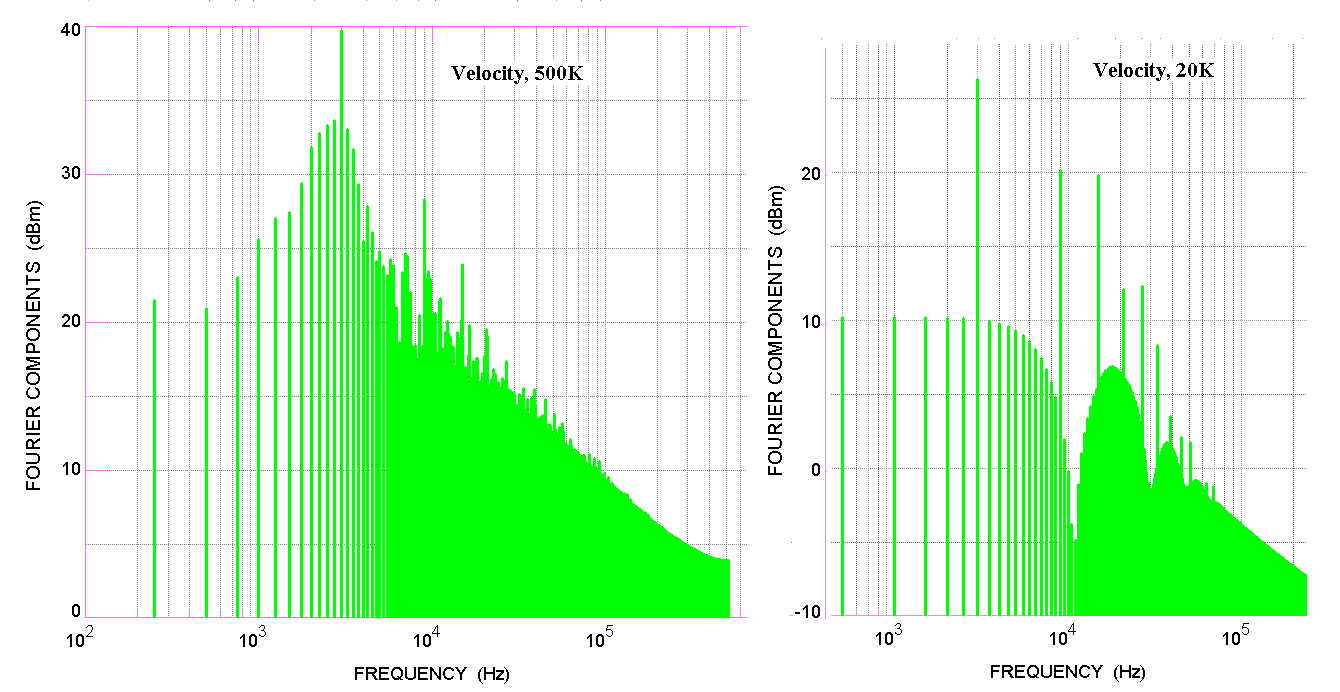
Figure 4. Comparison of the spectra corresponding to the two
cases of figure 3.
PHASE-SPACE PLOTS
Nonlinear systems are difficult to study in the time domain. The better graph is one in which velocity is plotted against position; some examples of which are shown for the yo-yo oscillator in figure 5.
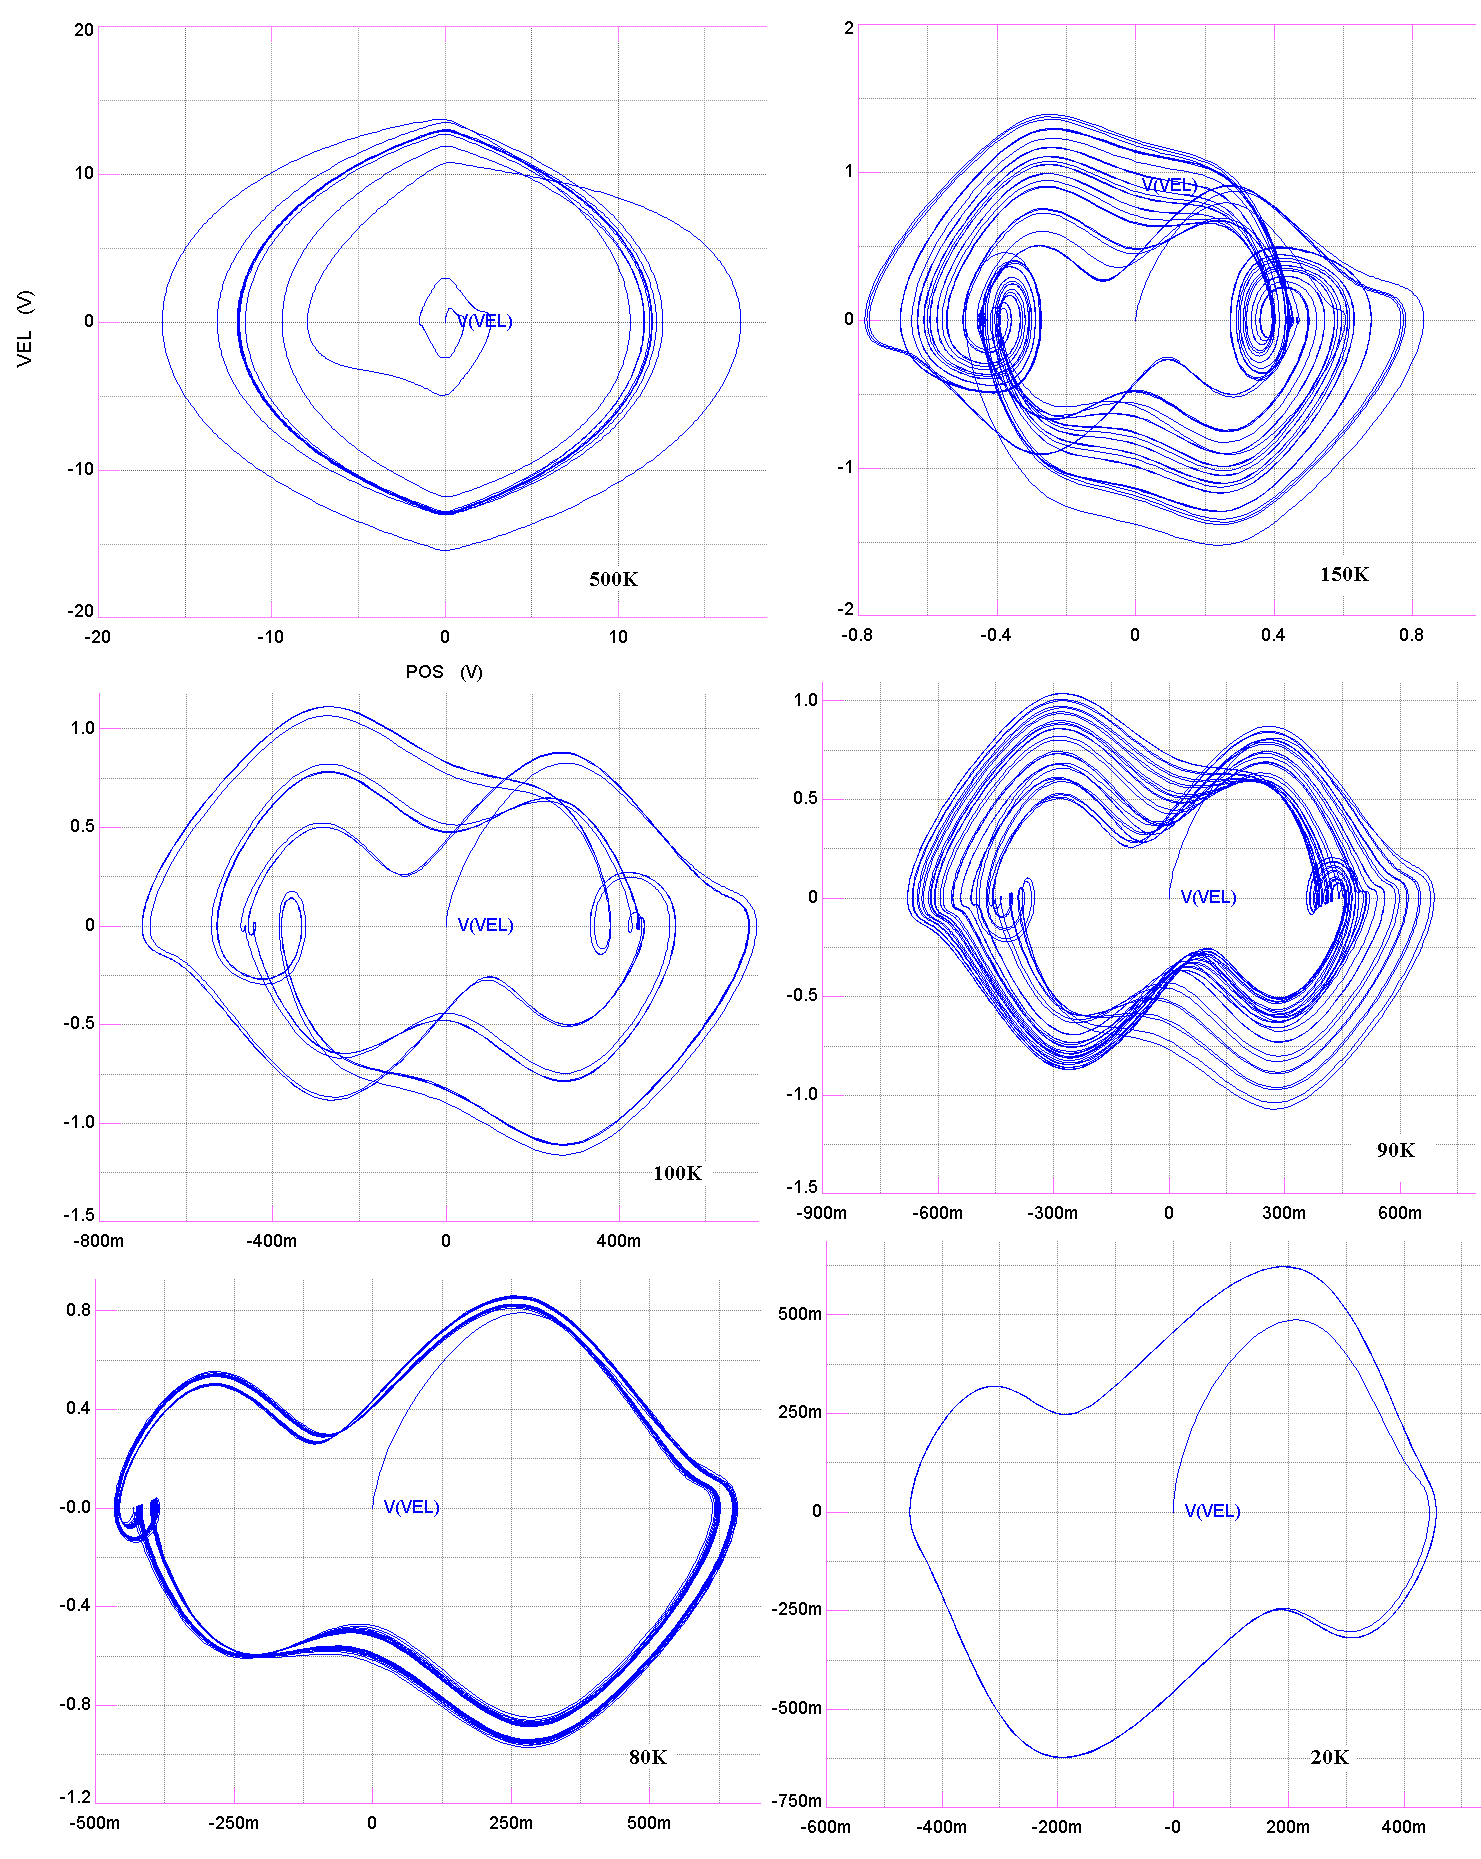
Figure 5. Examples of phase-space plots for the yo-yo oscillator.
The drive amplitude and the frequency (3.0 kHz) were the same
for each of the cases.
The parameter which was varied in producing figure 5 was the damping coefficient a, determined inversely by the size of the gain-resistor R11 in figure 1. The damping is smallest for the top left graph and largest for the bottom right graph. Notice that the figure provides evidence for a period-doubling (or perhaps other) route to chaos. The 90K and 150K cases are suggestive of chaos and some of the others suggestive of period-n limit cycles. The best way to determine if in fact some of these (or other) cases are in fact chaotic is to `strobe' the phase plot to obtain a Poincare' section. The dimensionality of a fractal geometric structure that should remain after thousands of cycles in such a section is a measure of chaos. It is not known whether the TopSpice code (Penzar) used for this study is capable of generating Poincare' sections.
BODE PLOTS
One of the plots routinely used to analyze electrical networks is the Bode plot, in which the steady state response to an a.c. drive is plotted versus frequency, typically through several decades of frequency change. Such a plot for the yo-yo oscillator is shown in Figure 6.
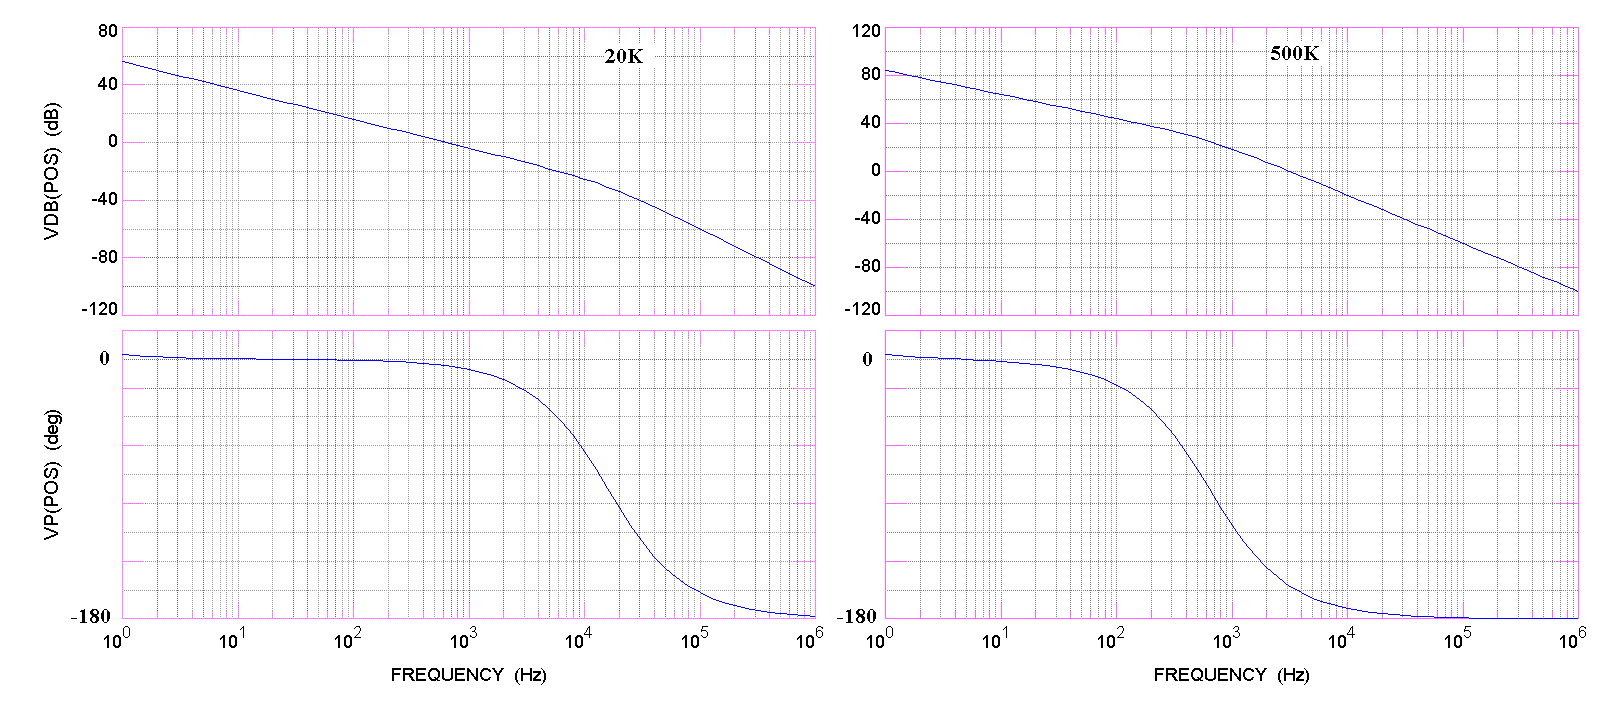
Figure 6. Bode plot for the yo-yo oscillator.
There are only two features of figure 6 that are the same as the Bode plot for the driven, damped simple harmonic oscillator (SHO)-the 40 dB/decade falloff at high frequencies, and the p drop in difference of phase between oscillator and drive in going from low to high frequencies. Unlike the constant response below resonance for the SHO, it is seen that the yo-yo oscillator has a 20 dB/decade falloff at low frequencies. The place where the 20 dB/decade character meets the 40 dB/decade character is different according to the damping. For the large damping case (20K) this occurs above 10,000 Hz, whereas for the low damping case (500K) it occurs below 1,000 Hz. Unlike the SHO, the yo-yo oscillator does not display a sharp resonance for low damping.
FUTURE PLANS
The Spice code permits one, without extensive breadboard work by trial and error, to build an actual analog computer that emulates the yo-yo oscillator that was first studied in ref. [1]. Outfitting that original mechanical oscillator with sensors would not be very productive, because of its long `periods' of motion. By working with the opamp-based analog computer shown in figure 1, it should be possible to generate all data required for an exhaustive study in a short total time of data acquisition.
BIBLIOGRAPHY
1. R. D Peters & T. Robinson, ``Constant Force-magnitude chaotic
Oscillator'', online at http://arxiv.org/html/physics/0303098.
2. R. D. Peters, ``Beyond the linear damping model for mechanical
harmonic oscillators'', online at
http://arxiv.org/pdf/physics/0408091.