Mechanical Cardiography using a Geophone
Mechanical Cardiography using a Geophone
Randall D. Peters
Physics Department
Mercer University
Macon, Georgia 31207
(Copyright 26 January 2005)
Abstract
It is shown that a commercial geophone of the type used for oil prospecting
may be useful for heart diagnostics, when connected to a personal
computer through a user-friendly though powerful analog to digital converter
with associated processing software.
1 Background
Various studies by the author have shown the importance of synergy in
three key elements of an experiment; these are (i)
the sensor, (ii) the interface between sensor and computer, and
(iii) the analysis software.
Poor performance in any
one of these three elements seriously degrades one's ability to
understand the experiment.
1.1 The personal computer
The inexpensive pc has dramatically improved analysis capabilities in
general. Before its existence there were already some very good sensors.
Unfortunately, means for coupling these sensors to the computer
to yield a user-friendly while still powerful package have been limited.
The Dataq company (www.dataq.com) has produced some inexpensive analog to
digitial converters, with associated software, that represent a significant
improvement in the interface/processor state of the art.
The connection of the converter to the computer via the USB port is
straightforward. And the Dataq analysis software, which operates on
the *.wdq files
generated during data acquisition-is the most impressive
set of algorithms used by this author. By means of windows
icons or hotkeys, one can quickly switch between display of a time record
and its associated spectrum. Moreover, the time record can be viewed
in detail using the smallest time increment estabished by the sampling
rate; or it can be easily compressed to view the complete record.
Additional straightforward filtering possibilities include (i) low-pass,
(ii) high-pass,
and (iii) band-pass operations. These are accomplished by means of
the FFT and
its inverse.
2 Mechanical Cardiograph Experiment
An unknown commercial geophone (gift from Symmetric Research
in Kirkland, WA) was connected to a Dataq DI-700 analog to digital
converter. Records
at the maximum sampling rate of the converter (488.28 per s) were
collected on several human subjects. These were collected with the subject
either (i) lying on the floor with the geophone resting vertically on
the chest in the vicinity of the heart, or (ii) sitting with the geophone
resting in a shirt pocket in the vicinity of the heart.
2.1 Example time record
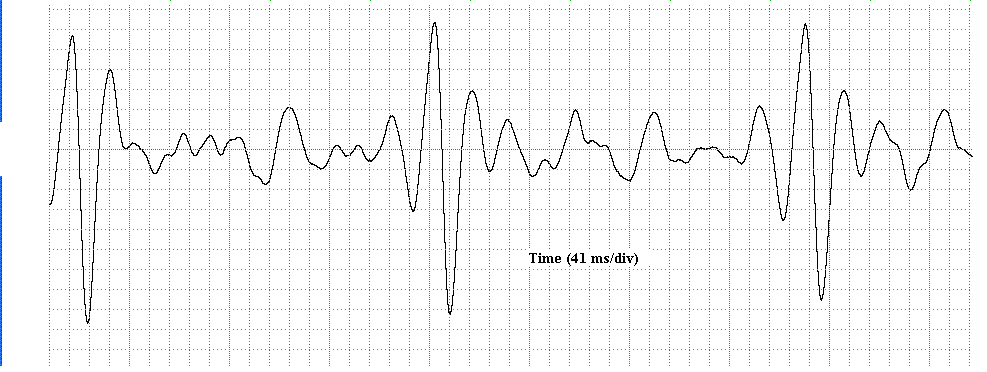
Figure 1 is
an example of a fully-compressed time record in which the subject was
prone.

Figure 1 Example of a mechanical cardiogram. The heartbeat is
evident in the tallest, sharp `pulses' of this compressed record.
An expanded time record is shown in Fig. 2, where various of
the higher frequency components registered by the geophone are visible.

Figure 2. Expanded portion of Fig. 1, having the
same units on the vertical axis.
2.2 Example spectrum
Shown in Fig. 3 is the spectrum that results from
taking a Hanning-windowed 1024 pt FFT
on a portion of the time record used to generate figures 1 and 2.

Figure 3. Spectrum associated with record that generated
the figures above. Input averaging of 3 was used.
In Fig. 3 there is clear evidence of mode mixing (due to nonlinearity)
between the heartbeat at 1.43 Hz and oscillations of the chest cavity
responsible for the largest peak in the comb structure at 10.65 Hz (lines
marked with the red arrows).
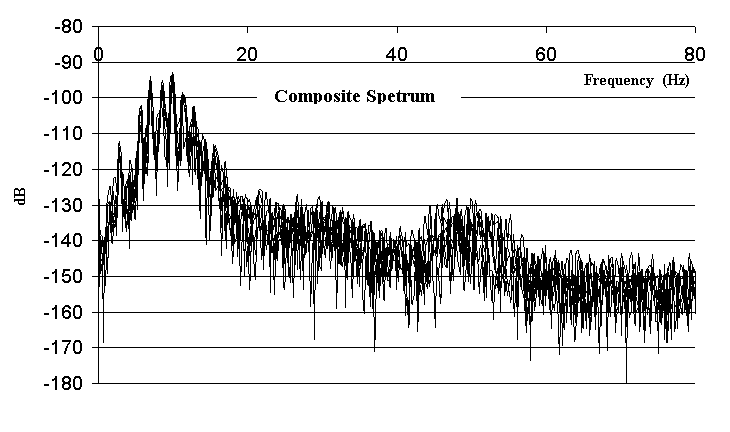
Various lines of the comb structure were found to persist for rather
long times, as evidenced by Fig. 4.

Figure 4. Composite of six overlayed spectra, taken at
equally-spaced-in-time increments of a record whose total length
was 59 s.
For the data of Fig. 4 the same subject was used, except now standing
with the geophone in a chest pocket, vertically oriented. The highest
peak in this case is at 10.01 Hz, slightly lower than the previous case.
This is probably consistent with compression of the chest cavity between the
normal force of the floor and gravity when the subject is prone.
2.3 Comparison of two subjects
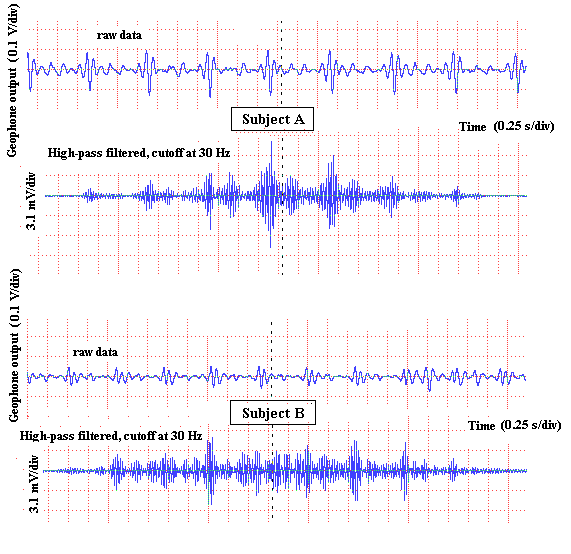
An example of the usefulness of high-pass filtering is shown in Fig. 5,
where records of duration 6.25 s have been shown for each of
two male subjects.

Figure 5. Spectra showing the difference between two male subjects.
Subject B has a known heart murmur.
In each of the top raw traces, more than eight
heartbeats are visible (more clearly for subject A).
Frequencies below 30 Hz were removed from the spectrum to generate
the high-pass filtered traces shown. They begin and end with zero-amplitude
because of the hanning window employed by the FFT algorithm.
It is seen that the filtered data of subject B is significantly
more noisy than that of subject A, presumed to be the result
of the known (longtime) heart murmur of subject B. Note also in the case
of subject A that there are clearly two-events per heartbeat in the higher
frequency
components of this mechanical cardiograph. It is assumed
that these are associated with mitral and tricuspid valve function. In
the case of subject B, the murmur is the result of mitral valve prolapse.
3 Valsalva maneuver
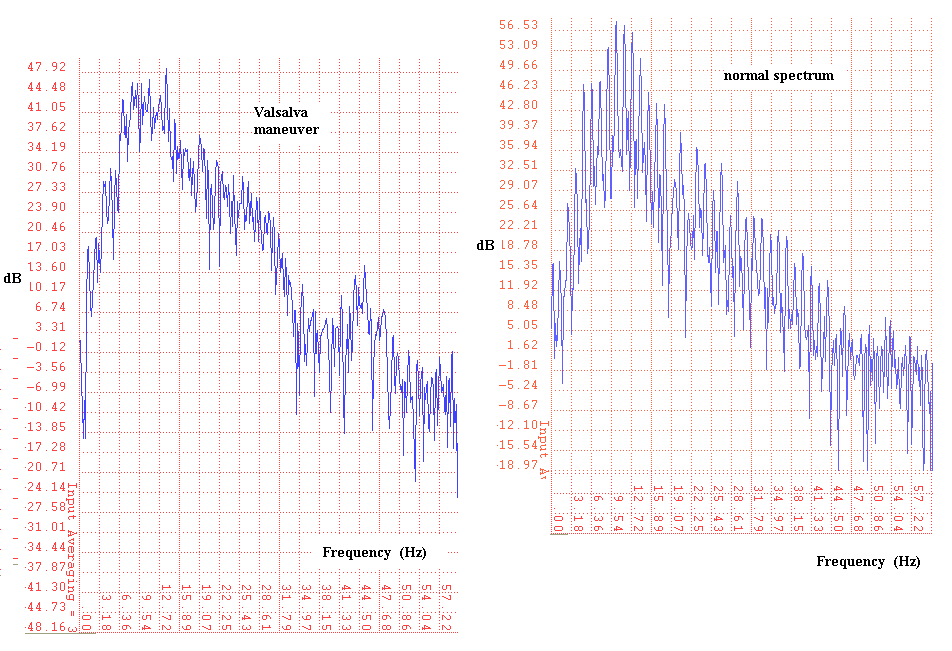
Shown in Fig. 6 (left side) is a spectrum taken with subject A
during a Valsalva
maneuver. A reference spectrum similar to that of fig. 3 is shown for
comparison.

Figure 6. Illustration of spectral change during a Valsalva
maneuver.
It is common knowledge from phonocardiography that this maneuver introduces
high frequency sounds, which are also implied by the hump in
the left figure, which peaks in the neighborhood of 44 Hz.
4 Difference from phonocardiography
In phonocardiography (electronic stethoscope) one listens to sounds
transmitted through the chest wall. As a seismic unit, the geophone
responds to acceleration of the chest. Thus one expects that chest resonance
would be more obvious in the geophone data. Mode mixing between the
heart/chest oscillators is in turn expected and the trial cases bear this
out.
5 Conclusions
These preliminary findings suggest that the methods described could be
of value for cardiac diagnostics. As with the historical development
of electrocardiography,
empiricism based on clinical testing will be
necessary to determine any true benefits.
Acknowledgement The author gratefully acknowledges
important contributions to this work from Drs. Matt Marone and Mike Russell.
File translated from TEX by TTH, version 1.95.
On 27 Jan 2005, 08:41.


