05.1100
Randall D. Peters and Eric Daine
Copyright September 2012
Abstract
A vertical seismometer of LaCoste zero-length spring type, that was once part of the World Wide Standardized Seismographic Network (WWSSN), has been modified to operate with state-of-the-art digital electronics. Damping is provided by means of the instrument's original Faraday Law (coil/magnet) detector. A previous first modification of the instrument was one in which the Faraday law detector was functionally replaced with a fully-differential capacitive displacement sensor array. The sensor electronics employed at that time was of analog type. The present digital configuration uses the same symmetric differential capacitive sensor. Power to the small board of this latest electronics package is supplied through a USB cable. The same cable is also used for communication between the computer and the heart of the package, which is the Analog Devices' 24-bit capacitive to digital converter MEMS chip, the AD7745.
Background
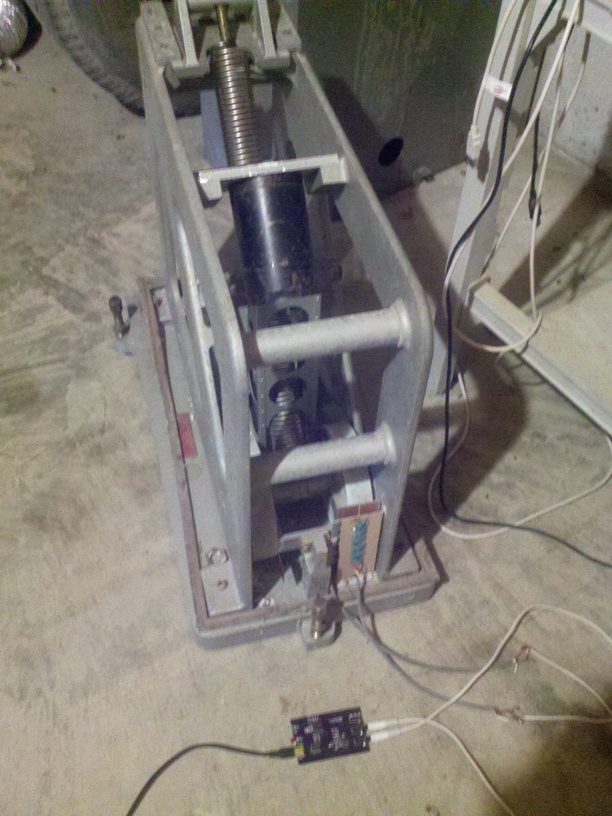
A photograph of the Sprengnether vertical seismometer is shown in Fig. 1.
This instrument was previously operated with analog electronics support [1].
Figure. 1. Seismometer shown connected to the digital electronics support board. The fully differential capacitive displacement sensor array [2] is visible in front of and near the instrument's seismic mass(es), a pair of lead cylinders. The reader is referred to article [1] for additional photographics details of the mechanical parts of the instrument as well as the displacement sensor.
A test of instrument sensitivity and linearity was performed by first looking at an oscillatory free decay in the absence of externally applied damping. A small (approx. 1 g) mass was placed on top of one of the instrument's pair of lead masses and then removed. The resulting motion is shown in Fig. 2.
Figure 2. Free decay without external damping (top graph). The quality
factor of 180 was determined by an exponential fit to the upper turning points
of the motion. The instrument's characteristic frequency is seen from the
spectrum (bottom graph, calculated from the time signal using the FFT) to
be close to 0.1 Hz. The plots of Fig. 1 were generated by means of Excel.
Harmonic distortion is visible in the spectrum, in the form of 2nd and 3rd harmonic components. It is thought to result more from anharmonicity of mechanical type than from nonlinearity of the sensor. Period of the motion (reciprocal of the characteristic frequency) can be altered by loosening screws and then changing the horizontal position of the (sliding) member to which the coiled spring is attached at its upper end.
Following the exercise that yielded the data for Fig. 2, the instrument was reconfigured to operate with external damping by using the original coil/magnet component to function as a damper rather than a detector. This was accomplished by simply shorting the sense-coil winding that moves with the masses inside the stationary alnico magnet (darkest component of Fig. 1, positioned above the spring).
Afterwards, to characterize instrument repeatibility, another small mass (approx. 0.5 g) was placed on one of the instrument masses and left in place until a new equilibrium position was established. Then the small mass was removed, and after equilbrium was re-established, the process was repeated. The resulting output signal is shown in Fig. 3.
Figure 3. Showing the influence of external damping, this plot also
illustrates repeatibility in the respnse of the instrument to an acceleration
`step'. Unlike with the previous data sets before graphing, the mean value
of the output in capacitive to digital converter (CDC) counts was not set
to zero for this case.
Previous Experiments with the Sprengnether
Over several years a number of research studies were conducted with the analog form of the seismometer, several of which involved the influence of hurricanes on seismicity [articles 3 and 4 in addition to 1]. Thus it was logical, because of the authors' development of various instruments using the present electronics [5] - to see if Hurricane Isaac would `also shake' our planet in ways similar to what was observed during earlier storms.
Spectra corresponding to Hurricane Isaac
Data analysis for the present study has not been as extensive in scope as was true of the previous hurricane studies. This was largely due to software limitations, as compared to the codes that were previously available, working with the analog to digital converters employed. Another difference is that data for the present work has been available only at a much higher sample rate of 50 per second, which makes analysis more cumbersome. The authors' goal is to eventually employ software that can retain the advantages of high sample rate, yet be user friendly by providing a helicord type display of the type used conventionally in the world of seismology.
Fig. 4 shows a time sequence of spectral `signatures', that illustrate features of seismicity variation as the eye of Isaac moved out of the gulf waters onto land.
Figure 4. Density spectra calculated with Mathematica's FFT operating
on time-sequenced records. For these records the instrument was sitting on
the basement concrete slab of the first author's house, located approximately
45 miles north of Atlanta, GA.
Each of the records shown in Fig. 4 were of the order of a few hours duration, and subsampled from 50 Hz to 5 Hz, resulting in the Nyquist (upper) frequency of 2.5 Hz.
The first case was generated from data saved on Tuesday, 28 Aug., approx. 2:00 pm EST. The most unusual case is no. 7, which was saved about 12 hours after the eye of the slow moving storm hit Louisiana on 29 Aug. The last case was saved at 07:00 EST, 31 Aug. Note for case 7 the reduced intensities of high frequency components, yet the lowest frequencies were very energetic. This appears to be consistent with the `calm' associated with the eye of the storm. Note also that in nearly all of the cases there is prominent evidence of the strong microseisms that hurricanes generate when over water, having periods in the neighborhood of approx. 5 s. Fig. 5 shows several of these microseism lines that were present during the collection of case 3.
Figure 5. Illustration of the strong microseisms generated by Hurricane
Isaac. The data for this plot correspond to the first 4096 points of case
3 of Fig. 4. The FFT was generated with Excel (4096 pts limit) rather than
Mathematica of the precious cases.
References
[1] R. Peters, ``Hurricane excitation of earth's eigenmodes (2005)'', http://arxiv.org/html/physics/0506162 (This article was concerned with Hurricane Charley).
[2] R. Peters, ``Symmetric differential capacitance transducer employing cross coupled electrodes to form equipotential pairs'', U. S. Patent, c.f. http://www.google.com/patents/US5461319
[3] R. Peters, ``Correlation measurements of Atmospheric Pressure variations and Seismicity during Hurricane Dennis (2005)'', http://arxiv.org/html/physics/0507137
[4] R. Peters, ``Earth oscillations induced by hurricane Katrina (2006)'' http://arxiv.org/html/physics/0604190
[5] Various instruments using fully differential capacitive sensors that operate with a capacitive to digital converter are described at http://symcdc.com