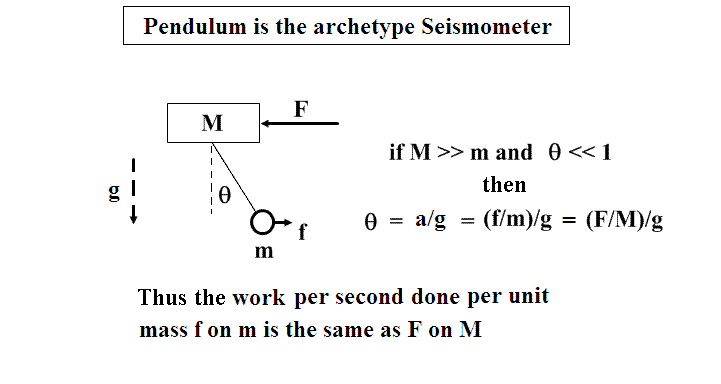
Figure 1. Illustration of a seismometer's response in relationship to the power per unit mass (specific power) of either (i) a segment of the earth having mass M, or (ii) the inertial element of the instrument having mass m.
Randall D. Peters
Physics Department, Mercer University
Macon, Georgia
Copyright December 2007
Introduction
Tidal friction power is readily estimated from the observed secular lengthening of the day; i.e, 2.3 ms per century. Assuming the moment of inertia of the Earth, using radius R = (2/p) ×107 m and mass M = 6 ×1024 kg to be given by 0.331 M R2, one obtains for the power 3.6×10¹² W.
The background seismic power of the Earth can be estimated from `quiet-time' data derived from the large number of instruments of seismographic network type. The Power Spectral Density (PSD) data of ref. [1] is presently used to make this estimate.
The Cumulative Spectral Power (CSP) derived from PSD data [2] allows one to estimate the total background seismic power of the Earth. In the calculation that follows, and which includes microseisms; total seismic power is estimated at 72% of the tidal power. In the absence of microseisms, the total seismic power estimate is reduced from 72% to 55%. It is concluded that tidal friction is a significant source of background seismic noise.
Theory
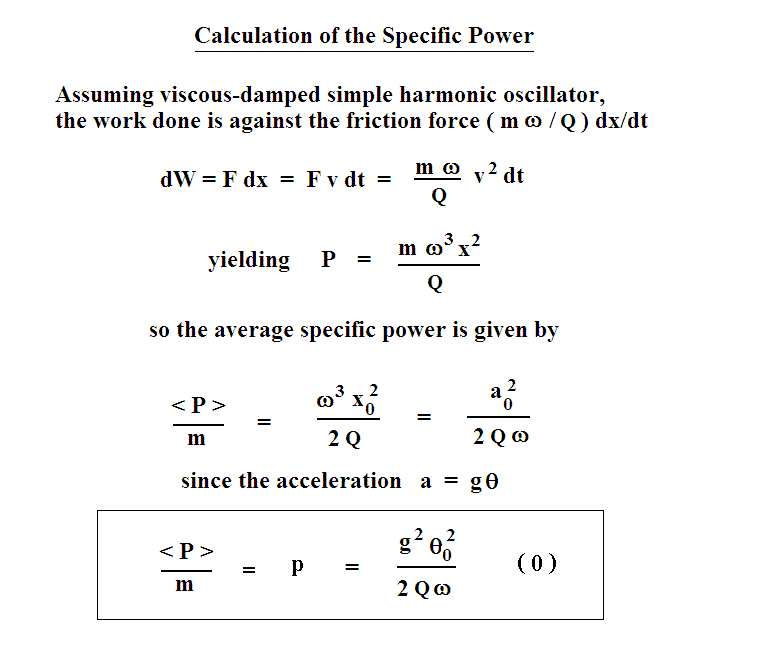
A seismometer responds to acceleration of the ground on which it rests, according to Fig. 1; and the specific power (power per unit mass) is calculated as shown in Fig. 2.

Figure 1. Illustration of a seismometer's response in relationship
to the power per unit mass (specific power) of either (i) a segment
of the earth having mass M, or (ii) the inertial element of the
instrument having mass m.

Figure 2. Defining relationship for specific power.
Equation (0) is used to calculate the Power Spectral Density (PSD) corresponding to a seismometer-generated temporal record. The quality factor of the instrument is nominally close to the critical damping value of 1/2 (0.8 being ideal). The earth's field is g = 9.8 m/s2, and q0 is the radian (dimensionless) amplitude (pendulum displacement) due to the harmonic-drive acceleration having angular frequency w = 2 p f
For frequency f of drive higher than the eigenfrequency f0 of the instrument, equation (0) must be corrected according to the following transfer function:
| (1) |
It should be noted that the units associated with p are m2/s3. Eq. (0) is used to calculate the PSD by replacing q02 with the square of the Fast Fourier Transform (FFT) of q0 and dividing by TF2, The units associated with this result are most readily understood when plotted using a linear-frequency scale. Such a linear graph (which is useless except when viewing a small range of frequencies), has units of W/kg per Hz. It should be noted that this is not the same as m2/s4 per Hz. Adjacent points in the plot are separated by Df = FN/(n/2), where FN is the Nyquist frequency and n is the number of points used to compute the FFT.
Most PSD's cover several decades of frequency, so a log-scale is essential. The specification of ordinate units for a spectral density graph involving log-frequency abscissa requires a correction for frequency `compression', when stated as some fraction of a decade or octave. The amount of compression increases linearly with frequency, and this compensates the reciprocal frequency term in Eq.(0). Therefore, simply plotting the square of the FFT of estimated acceleration yields the proper frequency dependence.
A useful PSD convention would be one of dB relative to m2 s-3 per 1/4 th decade, which is essentially also the same as per octave. Its utility derives from the fact that no multiplicative correction to Eq.(0) is then needed. A correction offset of -2.4 dB is required when using the density specification of 1/7 th decade, corresponding to the bin width employed in a well known study of earth noise [1]. There the bin width of 1/7th decade is not specified directly in the dB statement, but is supplied in the body of the paper. It should be noted that m2/s4 per Hz is not a proper set of units for such a graph.
Vibrational Power of the Earth based on PSD averages
If the preceding arguments are reasonable, then a profound, yet simple estimate for earth's vibrational power can be realized from the use of PSD global average data - following one more assumption-that the attenuation of all the modes of the earth is similar to the single mode of the seismic instrument; i.e., close to critical damping.
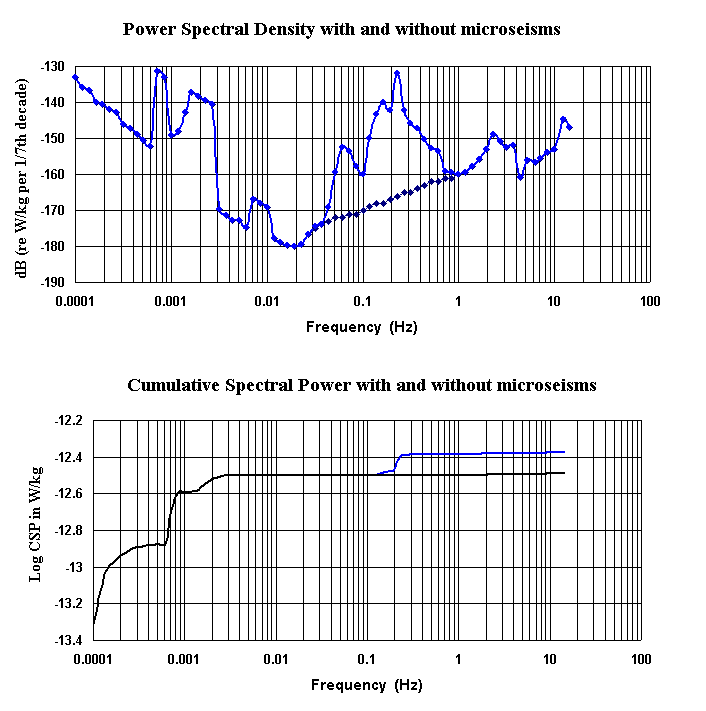
For this calculation we assume for our global-average PSD the `25% case' of the observations corresponding to horizontal-component-only of reference [1]. This 25% case is shown in the top graph of Fig. 3 below-which also includes the modified result corresponding to the 25% case except with microseisms `removed' (having a nearly straight segment from 0.04 Hz to 1 Hz). (Note that the PSD curves are here plotted vs frequency, whereas the plots of ref. [1] are vs period.)

Figure 3. `Global-average' PSD estimates for the earth (top
graph), and their associated Cumulative Spectral Powers (CSP) (bottom graph).
The CSP was obtained from the PSD by integration [2]. Its largest value (including microseims) is 4.27 × 10⁻¹³ W/kg. This number is used to estimate the earth's average vibrational power in the frequency range corresponding to the graphs of Fig. 3; i.e., about 0.1 mHz to 10 Hz. For the assumptions that have been described, this number is simply multiplied by the mass of the earth to yield
| (2) |
In other words, the total background seismic noise power is seen for the case on which this estimate is based to be 72% of the tidal friction power. Doing the same calculation, but for `excised' microseisms, yields 55%. In other words the microseismic contribution to the total seismic power is only 24%.
It is also interesting to compare these results to the solar power unto which our planet is continually exposed. Assuming 1400 W/m2 for the solar insolation, one obtains 2 ×10¹⁷ W. In other words, the earth's total vibrational power for the range indicated is only 13 parts per million of the solar power incident on the Earth.
Mechanism
The following mechanism is postulated as the means whereby the tidal force of moon and sun results in tidal friction that is allocated more significantly to eigenmode oscillations than to ocean mixing.
In its crustal (continental) makeup, the Earth may be likened to a multiply-cracked hard-boiled egg. Rolling the egg between both hands is analogous to the influence of the tidal force on the crust of the Earth. Every rapid anelastic relaxation associated with subduction of shell fragments must result in oscillation.
This premise requires a lunar-synodic periodicity to the earth noise. Such periodicity was noted in the first observations of incessant `earth hum' [3]. The oscillations that were observed to be largest during new- and full-moon were accidently discovered during the course of Kwon's PhD research that was concerned with adsorbed gases on solid surfaces. The Langmuir-recoil balance employed for these studies was sensitive to tilt and therefore responded to the lowest frequency eigenmodes of the earth, excited by the tidal force through anelastic relaxation.
Bibliography
[1] J. Berger & P. Davis, J. Geophys. Res. Vol. 109.
B11307 (2004).
[2] R. Peters, ``A new tool for seismology-the Cumulative Spectral Power'',
online at http://physics.mercer.edu/hpage/CSP/cumulative.html
[3] M. H. Kwon & R. Peters, ``The study of eigenmode types and source
nonlinearity in the free earth oscillations'',
Saemulli Vol. 35, no. 4, 569 (1995).