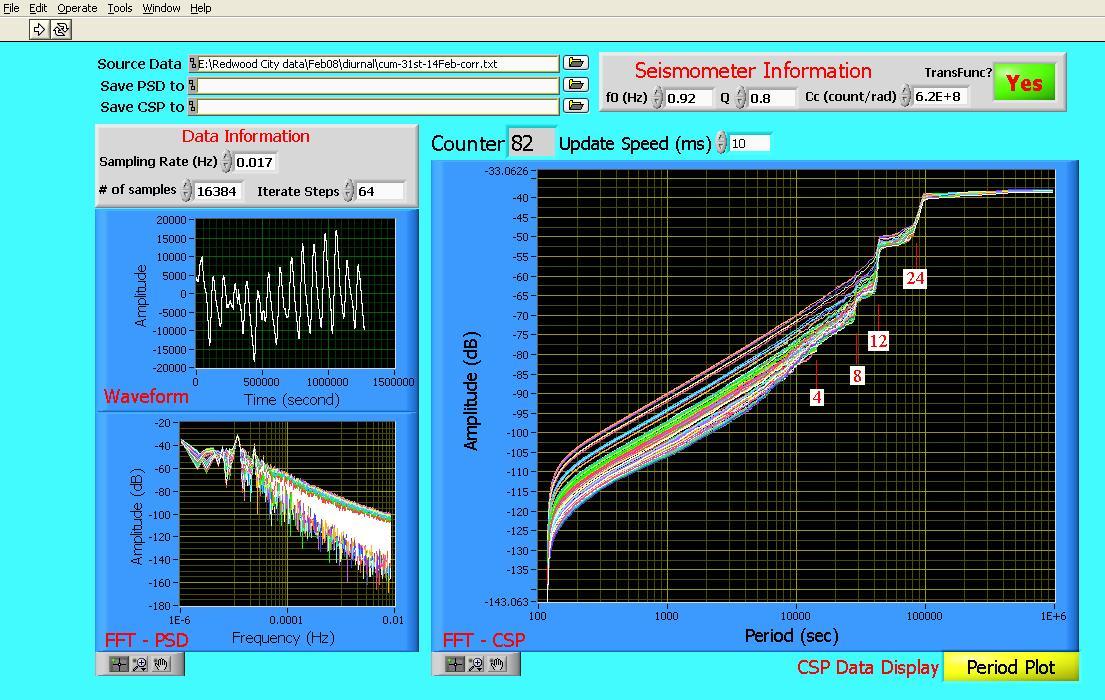
Figure 1 Example of how tidal information can be observed in the Cumulative Spectral Power generated from `simple' pendulum data.
Randall D. Peters & Sheng-Chiang Lee
Physics Department, Mercer University
Macon, Georgia
Copyright February 2008
Abstract
Most commonly, the word `tide' brings to mind the ebb and flow of oceanic currents. Less well known is the influence of Sun and Moon on the solid body of the earth. Less well known still is the tidal-force dynamic responsible for periodic pressure variations in the atmosphere of our planet. We here show that a `simple' pendulum is capable of providing information about all three phenomena.
Background
The influence of air pressure changes on the figure of the earth is well known to seismologists. Localized barometric pressure changes are known to produce greater noise in horizontal seismographs than in vertical ones. The seismic noise is greater in this case because horizontal instruments are sensitive to tilt.
The vast majority of commerical seismometers generate an output based on differentiation. Their response goes below noise for earth motions whose frequency is below (or even greater than) a mHz (period of 1000 s). Unlike these instruments, the first fully-digital seismograph ( VolksMeter [1] ) operates with a displacement sensor. Its symmetric differential capacitive (SDC) sensor (first fully-differential type) is not low-frequency limited, except by the stability of the electronics employed. It has been previously shown to be well suited to the study of earth hum. More recently it became clear, from the study of data accumulated at low sample rates (one per minute), that the VolksMeter is also a device well suited to the study of the tides. Here we illustrate that by means of data collected from a single site over the first half of Februaury 2008.
Mysteries of physics inevitably yield more quickly to analyses done in the frequency domain than in the time domain. The usual spectral method for displaying information (power spectral density based on the FFT) is seriously limited when it comes to the study of slowly varying quantities. Although the short time Fourier transform (STFT) has been employed for such purposes, it lacks in effectiveness. The investigator's eye/brain is not adept at assimilating the information thus presented. If it were not for `clutter' that is characteristic of the PSD (not noise, but rather the very nature of the Fourier transform, especially when calculated discretely via numerical methods), then the obvious way to gain better insight-is to overlay on a single graph a sequence of time-differing curves. In the case of the PSD, fluctuations make this problematic for anything other than a small number of curves. One means for improvement is to separate the PSD's in time by means of an added coordinate axis-giving rise to the so-called `water- fall' spectrum. The additional complexity of both the resulting graph and also the difficulty of computation make the waterfall display less than ideal. Yet another method uses `time-tagging'. Brightness and/or color can be used to provide visual `separation' among the different cases. As with the waterfall display, the added computational difficulty results in a cumbersome methodology.
Cumulative Spectral Power
Recently it was found that the cumulative spectral power (CSP) is ideally suited to simple overlay [2]. Because it is derived from the PSD by means of integration, the degree of clutter is dramatically reduced. Instead of external means to `separate' the `curves of confusion' one is allowed through the simple means of overlay to see how the system evolves by itself into differing spectral domains. This desirable property is illustrated in the figure below.

Figure 1 Example of how tidal information can be observed in the
Cumulative Spectral Power generated from `simple' pendulum data.
For the generation of the spectral graphs of this figure, 82 different curves were overlayed (adjacent cases separated in time from one another by 64 s). The temporal data shown in the small upper left graph corresponds to a record whose duration is approximately 15 days. The raw data collected by the N-S VolksMeter at Redwood City, CA has been corrected for d.c. offset, and also a small overall drift in mean position. The large diurnal variation that clearly dominates the signal is of thermoelastic origin; i.e., it is not mainly due to the crustal tide. It is known from other studies with a predecessor to the VolksMeter that this component would decrease significantly if the instrument were placed several meters below ground level, as opposed to its present surface location.
Although the spectral curves for this figure are colored, the color progression from curve to curve derives from the default properties of the LabView software with which the CSP algorithm was generated by Prof. Lee. It does not serve to time-tag the data, and sometimes a gray-scale plot brings greater clarity to pertinent features.
A comparison of PSD-overlays with CSP overlays shows very clearly the advantage of the CSP for this type of display. It is seen that interesting and little-known earth dynamics of tidal type can be readily gleaned from the CSP display; i.e., there is evidence for the postulate that the 4-h and 8-h tidal components of atmospheric type are influencing the crust of the earth. This postulate is based on the fact that the VolksMeter pendulum responds to tilt changes associated with shape deformations of the earth.
[1] Information about the VolksMeter seismograph is available online
at http://rllinstruments.com
[2] R. Peters, ``A new tool for seismology-the cumulative spectral power'',
online at http://physics.mercer.edu/hpage/CSP/cumulative.html