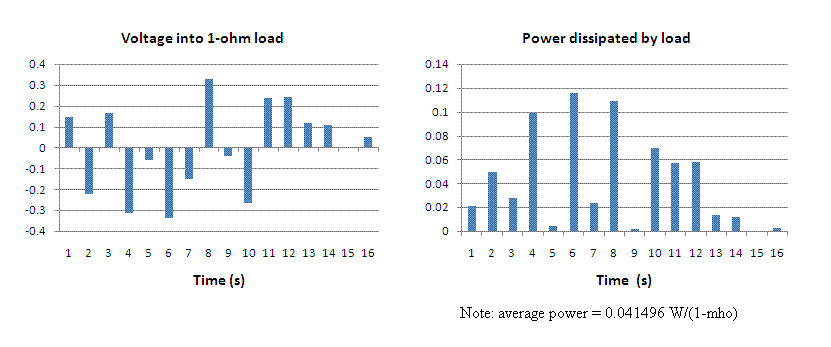
Figure 1. Simulated potential (left graph), converted from analog to digital form at a rate of one sample per second. The power in watts it dissipates in a 1-ohm resistor is shown in the right graph.
Copyright 7 November 2009
ABSTRACT
Each of (i) the mathematics of the Fourier Transform, and (ii) the
physics that describes
a seismic instrument, is characterized by subtle properties.
Confusion with either (i) or (ii) alone is enough for
several common erroneous conclusions.
Taken together, the challenge to proper interpretation
of a power spectral density is considerable.
This paper details theoretical features of the problems and with
experimental data from the author's state-of-the-art seismograph called
the VolksMeter, it is demonstrated that
seismic background noise is essentially 1/f (pink)
in the low-frequency limit.
Background
It is common practice to take the Fast Fourier Transform (FFT) of a
time series (no matter the actual physical properties of that series),
graph as a function of frequency in a log-log-plot the square
of the modulus of the transform thus calculated, and then label that
plot with the words ``power spectral density''.
The practice derives historically from the case of
electric power dissipated by a
one-ohm load resistor. For this electrical case, the units of the
graph are actually watts per mho per Hertz, where
the mho is the unit of conductance; i.e., reciprocal resistance. This
is acceptable IF
the FFT values are properly interpreted, which is a subtlety that is
discussed later in
detail. Much less confusion would
result if the graph were more carefully labeled `Specific Power Spectral
Density'. In other words, attention should be drawn to
the fact that the function graphed
is not power in W/Hz but is
actually W/mho/Hz. Most users of the FFT also ignore
a sublety that is concerned with `bin-width' of the density
function.
It is of little consequence if one is only
interested in comparing relative `sizes' of spectral components in
the same graph. On
the other hand, it is of great consequence if one is concerned
with absolute power specifications.
FFT Convention
Most FFT algorithms compute a density that IS NOT `per Hz' but rather
`per FFT point (width in Hz)'. To know the ideosynchrasies of a given algorithm,
one should employ Parseval's theorem, which requires that the average
power in the time domain signal must be the same as
the `integral' (sum over all spectral
components) in the frequency domain.
There is still another subtlety of great significance to absolute specifications, that is concerned with normalization. For reason of the methods used to minimize the amount of computer memory allocated for calculations using the Cooley-Tukey algorithm, the resulting spectral components are not usually provided in normalized form. For example, normalized output from Microsoft Excel's `Fourier Analysis' code requires that each component of both the real and imaginary sets be divided by the total number N of samples used in the generation of the transform. Like virtually every FFT algorithm, Excel requires that N be equal to a power of two raised to an integer exponent. Typically, for adequate resolution, N must be at least 1024; and 2048 (n = 11) is often considered to be the minimum acceptable total number of complex frequency domain components.
To clearly illustrate these subtleties, the following figures are provided, which are useful only for pedagogical purposes; since the FFT set-size is very small at N = 16 for some graphs and N = 64 for others. Each of these figures, as well as others provided later, were generated using Excel.
Shown in Fig. 1 (left graph) is a digitally simulated time record corresponding to an approximately white-noise electric potential that feeds a 1-ohm resistive load. The right hand graph, corresponding to the power dissipated by this load, was obtained by squaring the voltage record values. Note that the average power dissipated by the load resistor during the total time of 16 s is 41.496 mW. Fig. 2 provides the real and imaginary components of the Fourier Transform of the voltage record (left graph).

Figure 1. Simulated
potential (left graph),
converted from analog to digital form at a rate of one sample per second.
The power in watts it dissipates in a 1-ohm resistor
is shown in the right graph.
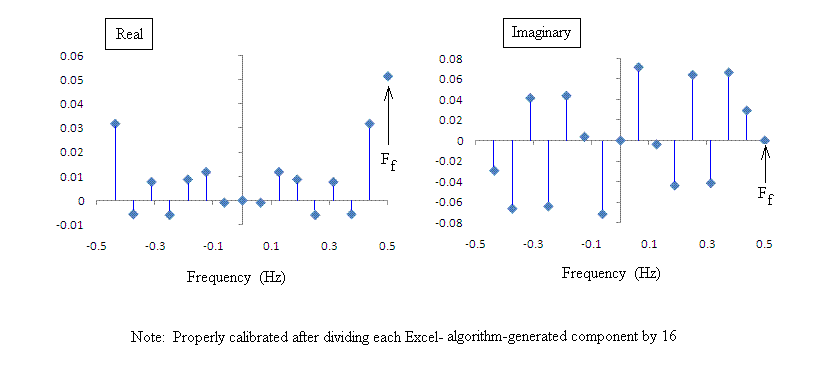
Figure 2. Real (left) and Imaginary (right) components
of the Fourier Transform corresponding to the time record of Fig. 1.
For a real-valued function, the real components of the transform form an even-function set, and the imaginary components form an odd-function set. Such even/odd character is clearly seen in Fig. 2.
The discrete Fourier Transform operates on a set of N unit-vectors that are equi-angle displaced from one another in the complex plane, with their tails located at the origin. Only when N = 2n, with n being an integer, is the `pie divided into N equal slices'. Details of the discrete Fourier Transform computational process is provided in Ref. 1. Because many of the calculations are multipli-redundant, the speed of the algorithm is dramatically improved by means of the computational technique discovered by mathematicians Cooley and Tukey. A conceptual appreciation for why their technique is so fast (improvement factor of 102.4 for N = 1024) is provided in Ref. 2.
By the very nature of the mathematics with which it is calculated, the Fourier Transform contains components associated with negative as well as positive frequency values. In the case of the FFT, a given algorithm usually supplies the components in an array whose index j varies between j = 1 and j = N = 2n as follows. Positive frequency components lie in the range from j = 2 to j = N/2, and negative frequency components from j = N/2 + 2 to j = N. The d.c. component (corresponding to the mean value of the time domain record) corresponds to j = 1. The `folding value' that separates the plus and minus set-pair is located at j = N/2+1.
Shown in Fig. 3 is the (Specific) Power Spectral Density (sPSD) corresponding to Fig. 1
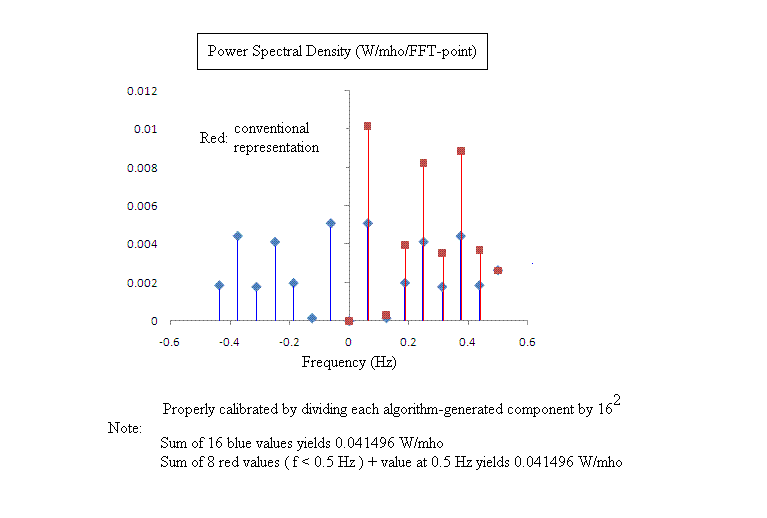
Figure 3. Here the real and imaginary components of Fig. 2
have been combined to generate the (specific) Power Spectral Density.
Fig. 3 shows in blue the form of the PSD that mathematicians would probably find most desirable. It is sometimes called the `double- sided transform'. Its values correspond to the square of the modulus of the (normalized) transform shown in Fig. 2; i.e., for a given term the product of the complex number with its conjugate (equal to the sum of the squares of real and imaginary parts). Negative frequency components are conceptually challenging to non-mathematicians, and so a now common `single-sided' (`conventional form') for the PSD is shown in red. It is helpful to draw specific attention to the set of frequencies shown in Fig. 3. The time record used to generate the transform was sampled at one sample per s. The largest (absolute value) frequency component in the set, known as the Nyquist frequency, is equal to one half this sample rate less the value of Df that separates adjacent components; i.e., (0.5 - 0.0625) Hz = 0.4375 Hz.
Note that the zero-frequency (d.c.) component of the transform in Fig. 3 has the value zero. This is consistent with the fact that the mean value of the 16-sample voltage record of Fig. 1 is itself zero. The unique (single value) of 0.5 Hz (that `separates' the set of positive and negative frequencie) is referred to as the `folding frequency'. It is not normally shown in the PSD. The average power for the time record is simply obtained by summing all the values (peaks of the column graph) of the right-hand plot of Fig. 1 and dividing that sum by 16. The same average power is obtained from the (properly normalized) math-form of the PSD by summing over all 16 of the blue components. A sum over all the single-sided-case (red) values yields the same average power. Notice, however, that a factor of two multiplier (excepting the folding frequency value) has been used to generate this set.
Representations
Per Hz contrasted with per FFT-point
The vast majority of PSD's found in literature publications use units in which the bin-width relevant to the density statement of the graph is specified as `Hz'. None of the several FFT algorithms that have been used by the author are suited to the direct use of Hz, but rather to the use of `FFT-point (width)'. In other words, the use of such algorithms will result in a constant-offset error unless a correction (multiplicative constant) is employed that transforms the inherent output in W/FFT-point to one in W/Hz. The significant (absolute) difference between these two is illustrated in Fig. 4.
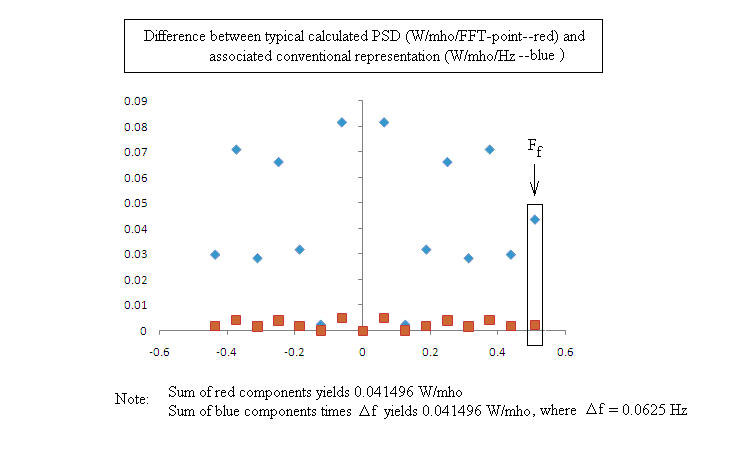
Figure 4. Illustration of the large offset error that can
result by assuming that a Fourier transform source code
automatically generates values
for which the bin-width of the density function is `Hz'.
The way to insure that the significant (absolute) error of Fig. 4 is avoided is to work with a test case as follows. From the time record generate the transform. In turn, generate the inverse transform by operating on the complex conjugate of the first transform. Experience suggests that the majority of FFT packages in common use will in the final result of this test yield the following - the original function, except multiplied by N. In other words, as with the cases generated here using Excel, one must divide the raw PSD values by N2 to correct for inherent non-normalization. Additionally, the then-normalized PSD units are in terms of W/FFT-point. To convert these units to W/Hz, one must divide each W/FFT-point value by D f which is equal to the ratio of Nyquist frequency to ( N/2 - 1 ).
Per Hz contrasted with per Octave
Though most PSD graphs are displayed in terms
of the density variable Hz, it
is more proper in a log-frequency plot to instead use the octave (or decade).
Only for a linear-frequency graph can abscissa numbers with units make
formal sense.
This is true not only for the logarithm, but for any mathematical
function. Physics students appreciate this issue when, for example,
working with a wave function. The spatial variable (units of meter)
must be multiplied by the wavenumber (units of reciprocal meter) before
being used in the argument of the wavefunction. Similarly, the time (units
of second) must be multiplied by the frequency (reciprocal second) before
acceptance.
Every math-function allows only dimensionless arguments. We see then
that the use of the bin-unit Hz in a log-plot is a bastardized
representation, since
one must in mental-gymnastic manner associate the log graph with the
linear one from which it derives.
For a given frequency dependent function, there is a dramatic difference of appearance between the two cases of log-plot using Hz and the more proper log-plot using Octave. This is illustrated in Fig. 5, which corresponds to a (very) roughly white electrical noise.
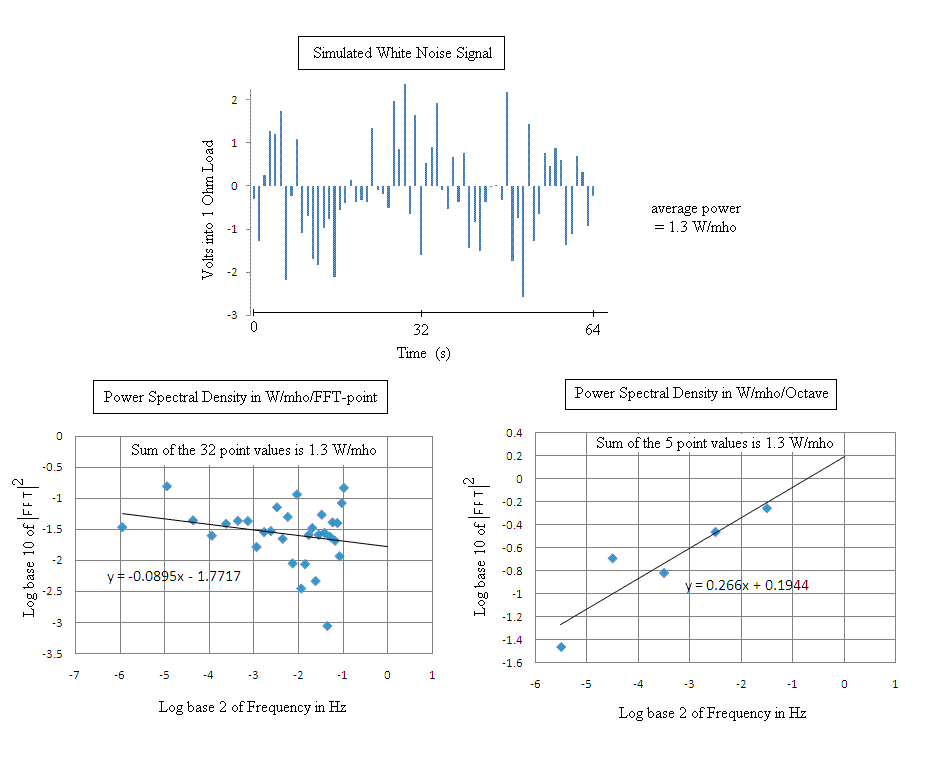
Figure 5. Illustration of the difference between a PSD represented
per Hz as opposed to per Octave.
The natural abscissa for the PSD of Fig. 5 is one using the logarithm to the base 2, since it relates most simply to the octave. Observe that there is a compression of the number of points per octave as the frequency increases. The spacing between points D f would be constant for a a linear plot of the same data. Thus the compression is due to the math-nature of the differential of the logarithm; i.e., d log f = df / f. Since df is constant, d log f decreases as f increases. Attention is drawn here to this matter because it is a key to understanding the proper units of a seismometer's PSD.
Notice in the left-hand graph that the number of points per octave in adjacent bins differ by a factor of two. Between -6 and -5 of the abscissa, there is a single point. Going to higher frequency between -5 and -4, this number has doubled to two points. Indeed, with every octave increase in frequency there is a doubling of the number of points per octave.
Because the record consists of 64 points, the single-sided PSD contains 32 points. The trendline slope of -0.09 would be -0.45 if the abscissa were log to the base ten. Thus the hoped-for slope of zero, corresponding to white noise, was not achieved primarily because of the small value of N.
In the right-hand graph, a single point per octave is utilized; in the range from -6 to -5, it is the same point as the one in the left-graph. In the range from -5 to -4, the single point of the right graph is equal in value to the sum of the two-point values of the left-graph (and so on as the frequency increases; i.e., the single point corresponds to the sum over all points in the same bin of the left-graph. This important distinction is lost when the graphs are generated (usual representation) without showing the points explicitly (rather only a line graph connecting the points). Thus there is loss of recognition of the critical `weighting factor' that is proportional to frequency for the case of W/octave. The importance of this weighting factor is clear from the two graphs. If the noise function were indeed white, then the slope of the trendline in the per Hz graph would be zero. In the case of the per octave graph the same slope would be +1 if the abscissa were log base 10.
Other noise cases are also commonly discussed. The 1/f (pink) noise of
a per Hz display becomes 1/f0 (flat per octave but
looking like conventional white) when using a per
octave display. The per Hz 1/f2 of brown noise (also sometimes
called red) becomes `apparent pink' when plotted per octave. It is
critical that the reader recognize this sublety relative to later discussions
of the (physically meaningful) specific PSD of a horizontal seismometer.
Physics of the VolksMeter Pendulum
The power of horizontal motion of the earth in W/kg, as measured
by the pendulum (of gravitational type) is given by
| (1) |
where g = 9.8 m/s2 is the magnitude of the earth's gravitational field, and Cc = 2.5×10⁹ counts/rad is the calibration constant to convert the capacitance to digital converter output count into an angle in radians. The transfer function is given by
| (2) |
where the natural frequency of the pendulum is f0 = 0.92 Hz and its damping is near critical at Q = 0.5. The amplitude of pendulum deflection (due to acceleration or tilt) is q0 in Eq.(1). The angular frequency of pendulum drive is w = 2pf, and so the units of P are W/kg = m2/s3. After taking the Fourier transform of q0 (using code equivalent to Excel), Eq.(1) yields for the specific PSD (in a linear frequency plot) units of m2/s3/FFT point, which can be converted to m2/s3/Hz as noted earlier. Such form is the only acceptable set of units for a physically meaningful (specific) power spectral density (sPSD). The primarily useful consequence of the acceleration spectral density (ASD), that is widely employed and has units of m2/s4/Hz - is that it allows its many users to do meaningful intercomparisons of the data output from their various differing instruments.
Interestingly, if one plots the sPSD in terms of W/kg/octave using a log plot, the result is the same in shape to a graph of ASD in m2/s4/Hz. This equivalence derives from the compression (weighting factor) discussed earlier in the context of the log plot. In other words, the plots for the two cases have the same shape when calculated with Eq.(1) and accounting for compression (units of W/kg/octave) and the conventional calculation using acceleration but ignoring the compression (units of m2/s4/Hz. Some in the seismology community have been confused by this subtlety, apparently for the last three decades. They try to make `power sense' of their physically meaningless ASD by replacing Hz with 1/s to give m2/s3. Doing so completely alters the nature of the function and makes it logically useless, since it no longer has the math capability to represent a density.
Pendulum response to tilt
In the limit of low frequency drive, the gravitational pendulum responds to tilt, while at the same time it is unresponsive to the associated accelerations of both vertical and horizontal type, that are responsible for that tilt. There is no power associated with the instrument's tilt response, only with the accelerations causing the tilt. Unfortunately, the tilt response is unavoidable, and seismologists have for years sought means to compensate for (correct in such a way as to ignore) its influence. This subtlety is key to understanding the final conclusions of this article.
In Ref. 3 it is shown that the instrument's sensitivity ratio, acceleration to tilt, is proportional to drive frequency. The cross-over frequency below which tilt begins to dominate was estimated to be fc = 0.00125 Hz. Consequently, although Eq.(2) applies for f > fc it is not valid for drive frequencies below this. For f < fc, Tf must be multiplied by the factor ( fc/f ).
Examples of Very Low Frequency (VLF) VolksMeter data
Shown in Fig. 6 are graphs of tilt data from each of (i) the north-south pendulum and also (ii) the east-west pendulum of the dual-channel VolksMeter located in the seismic laboratory of Mercer University in Macon, GA. The red curves correspond to the year 2009 and the blue curves to 2008. Only with additional data collected for several more years will it be possible to determine with confidence whether there is a seasonal feature to the records; i.e., a dip occurring around the time of the vernal equinox.
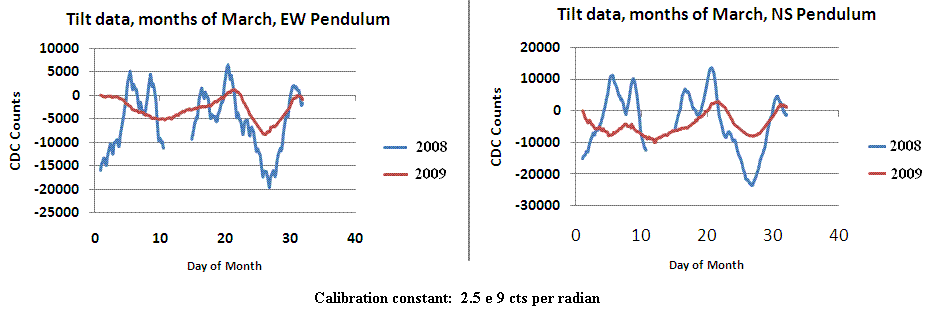
Figure 6. Tilt data from a two-pendulum horizontal seismograph
recorded during the month of March for both years 2008 and 2009.
All the curves of Fig. 6 are approximately of brown type 1/f2 when the counts of a given record are used to (blindly) calculate a so-called PSD in the manner discussed in the background section above. When calculated properly in accord with Eq.(1), and with the transfer function corrected as noted, the long-time records are consistent with 1/f (pink) noise, as shown in Fig. 7.
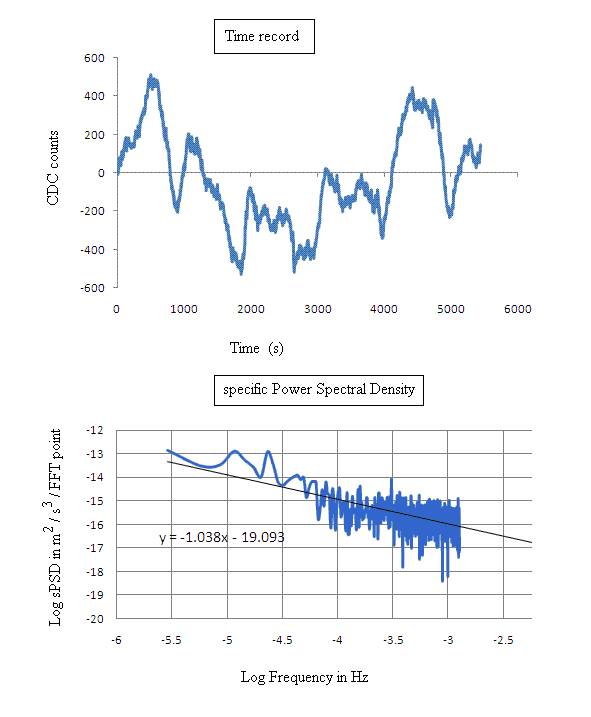
Figure 7. A four day tilt record generated by a VolksMeter
pendulum (top) and the specific Power Spectral Density associated with the
time domain graph.
This power curve is seen to be essentially pink because the value of the trendline slope differs only by 4 percent from the required -1.
Conclusion
It is gratifying to finally have evidence from experiment, analyzed with
an improved theoretical model, that supports the
author's following claim:
The background seismic noise of the earth is, in the limit of low frequencies, of the same spectral type as the most common form of nature, which is called 1/f or pink.
Bibliography
[1] R. Peters, ``Fourier transform construction by vector graphics'',
Am. J. Phys. 60, 439-441 (1992).
[2] R. Peters, ``Graphical explanation for the speed of the Fast
Fourier Transform'', online at
http://physics.mercer.edu/hpage/psn/graphical-FFT.pdf
or http://arxiv.org/html/math.HO/0302212
[3] R. Peters, ``Tutorial on gravitational pendulum theory applied
to seismic sensing of translation and rotation'',
Bulletin of the
Seismological Society of America,
May 2009, v. 99; no. 2B; p. 1050-1063.