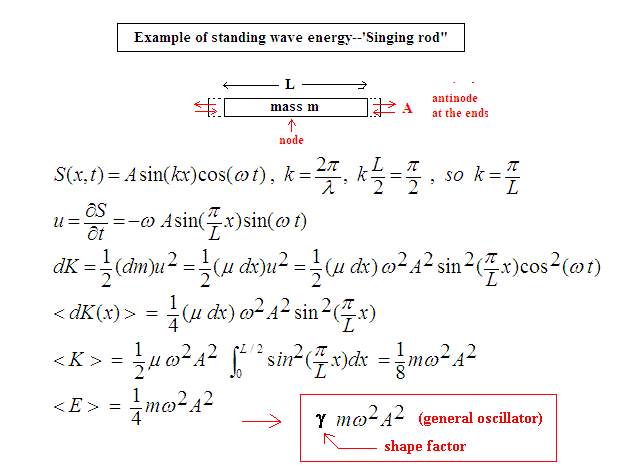
Figure 1. Example of a mechanical standing wave oscillation.

Figure 1. Example of a mechanical standing wave oscillation.
The energy expression, corresponding to a specific mode, applies generally to more complicated systems, including the Earth. The key thing to note is that the energy involves the square of both frequency and amplitude and is proportional to the total mass of the system. In the case of the Earth, any global oscillation must involve its mass mearth = 6 × 1024 kg. What makes the Earth case exceedingly more computationally difficult is the unspecified shape factor g. The simplest Earth eigenmode is the prolate/oblate spheroidal oscillation involving the Legendre polynomial of order two. From free-earth oscillations following large earthquakes, it is known to have a period of 53 min. It is instructive to consider the energy expression of Fig. 1 relative to estimates of earthquake energies. The most intersting case to consider is the great Sumatra-Andaman earthquake of 26 December 2004. The great interest in this event has resulted in a plethora of scientific estimates for various parameters. The energy released has been estimated to be of order 1.1 × 10¹⁸ J, with crustal amplitudes of motion as large as » 1 cm [3].
For purpose of comparing these numbers with our generic energy expression in Fig. 1, let us assume that the 1 cm motion corresponded to that of the lowest frequency eigenmode (53 min period). This results (for an assumed g = 1) in an energy estimate for the mode of 2 × 10¹⁵ J. The result does not appear unreasonable, at 0.2% of the total energy budget, recognizing that many modes were excited by the earthquake.
It is also instructive to compare the energy expression with results using the formulas for surface magnitude and energy of earthquakes [4].
| (1) |
where v is ground velocity in mm/s and D is the distance between source and observer in degrees. For the Sumatra-Andaman earthquake (E = 1018 J), the second equation yields the value Ms = 8.9.
Although completely unrealistic, imagine the hypothetical situation in which all of the energy of the earthquake could be fed into the 53 min mode. For this case it is logical to use D = 180 degrees in the first equation. After substituting and solving for v and then computing Emode = gMearth w2 A2, where A = v/w one obtains Emode = g · 1.27 ×10¹⁸ J. Since g < 1, we again find reasonable self-consistency.
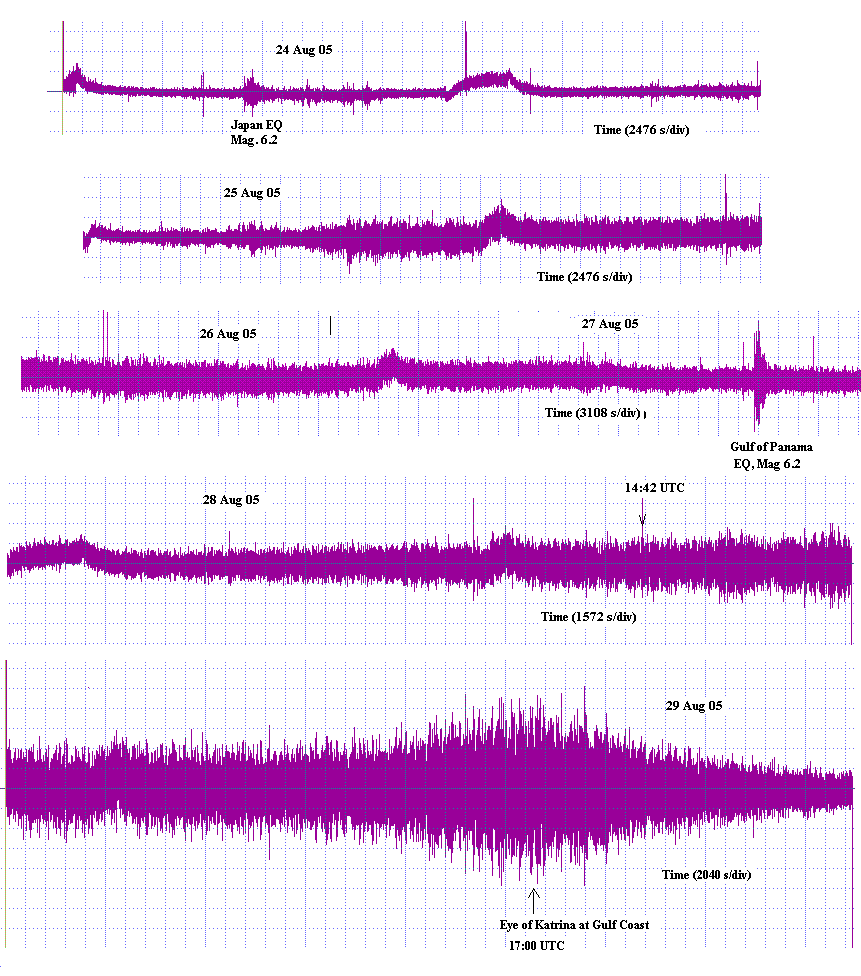
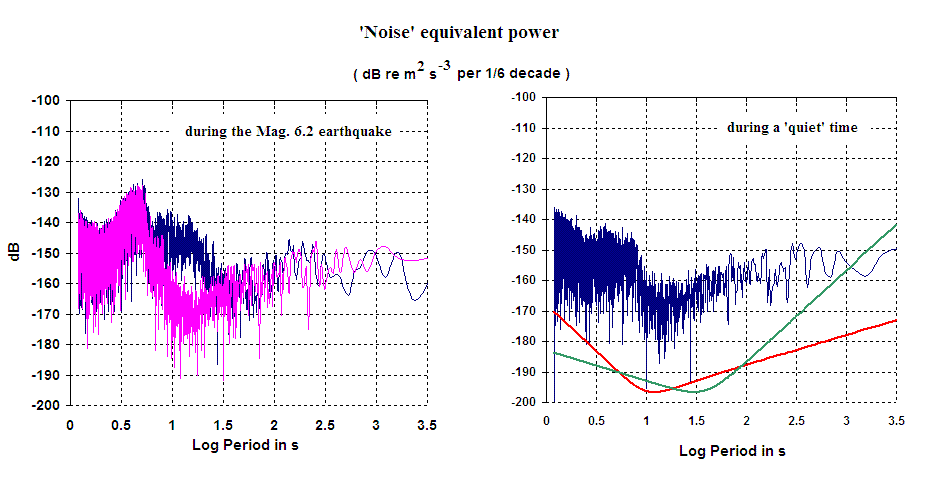
Figure 3. Noise power (blue) from the Panama earthquake (left figure).
The reference background (red) was taken from a record that just preceded
the arrival of body waves from the event. For comparison, the right
graph was generated from a quiet section of the 24 Aug data. The solid lines
show the difference between noise equivalent power due to electronics-only
(`flat' to frequency)
of the present experimental system (red) as compared to conventional
force-balance seismometers (green). It shows clearly why `position', rather
than `velocity' sensors are needed to study low-frequency motions of
the earth.
The figure was generated using Excel and the dB values are computed on the basis of force per unit mass; i.e., from Newton's second law, the product of ground velocity and acceleration (vertical component of the motion). Estimates of ground displacement amplitude Aground must account for the transfer function of the seismometer, whose dependence on frequency f is assumed to be
| (2) |
where A is the displacement of the seismometer mass relative to its case. This motion is measured by the fully differential capacitive sensor array [5] employed by the modified Sprengnether seismometer, having a calibration constant of approximately 2000 V/m. The natural frequency of the instrument is roughly f0 = 0.1 Hz and it is almost critically damped. For the calculations of Fig. 3, Q = 0.8.
The equation for the frequency dependent noise power per unit mass, assuming harmonic motion (on which eq. 2 is based) is obtained by recognizing that v = w Aground, and a = w2 Aground, meaning that the power has a cubic frequency dependence. Thus one obtains
| (3) |
The A(f)'s in Eq.(3) are obtained by means of the FFT, which for Fig. 3 used N = 8192 points. The record was collected at a sample rate of 5 per s. Input averaging of 3 (triplets of the record) was employed, so as to encompass the essential whole of the earthquake (total duration of 4900 s). The Nyquist frequency was fN = 0.833 for this choice.
The power spectrum shown in the figure is for `bins' of width 1/6 decade, whereas the dB values generated by the FFT is power per d f = fN / (N/2). At the lowest frequency of fmin = 2.03×10⁻⁴, these differ by a factor of 0.64; but the magnitude of the difference is directly proportional to the period.
The total earthquake power at Macon, due to the vertical component of motion, was estimated by a numerical integration. The rms difference between earthquake record and background record were integrated over the full frequency indicated by the figure. This was accomplished simply with Excel by summing over the 4096 relevant points.
This integration yielded for the power per unit mass the value 6.1 × 10⁻¹⁴ W/kg. Multiplying this number by the mass of the Earth (6 × 1024kg) and the time duration employed (4900 s) yielded the uncorrected energy value Eunc = 1.8 × 10¹⁵ J. Of course the whole earth is not oscillating with the same energy. Note that the expression for earthquake energy in Eq.(1) involves a distance factor 1.66 Log D, which means that the uncorrected energy should be decreased by an amount that depends on D. Assume that the energy is spread over the surface of the earth isotropically, so that the loss of intensity due to area increase is much greater than the loss due to absorption. This yields a multiplicative correction factor of (1 - cosD)/2. For the present case this is approximately 0.04, yielding a final estimated earthquake energy (based on Fig. 3) of 1.732 ×0.04 ×1.8×1015 = 1.2 ×10¹⁴ J. The factor of 1.732 (square root of 3) assumes that the energy is equally dividied among the three components of ground motion, only one of which (vertical) was measured.
This compares reasonably well with the energy value obtained directly from the second expression of Eq.(1), using the catalogued magnitude of 6.2; i.e., E = 1.5 × 10¹⁴ J.
We see from these considerations (a third independent test) reasonable agreement between experiment and the simple theory indicated in Fig. 1.
The ramp up to the plateau in the upper curve of Fig. 4 corresponds to the time when the hurricane gathered strength off the east coast of Florida; earlier it had been a tropical storm over the Bahamas. The decline in frequency as time progresses (lower graph) is consistent with the author's study of earlier hurricanes [5] As seen with hurricane Charley, deeper water results in lower frequency microseisms.
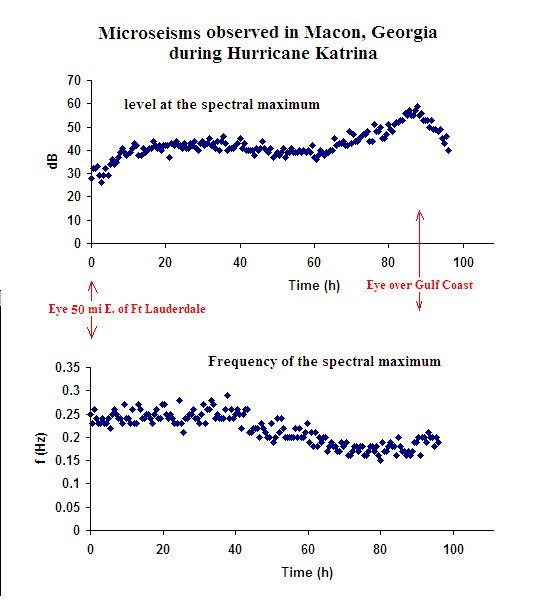
Figure 4. Variation of the spectral properties of the microseisms
generated by Hurricane Katrina.
Unlike the long-lived free-oscillations that are observed after very large
earthquakes, the eigenmodes described here will be seen to be short lived,
rarely enduring for more than a dozen cycles. Some would claim
that transient spectral lines with lifetimes so short are nothing
but spectral `noise'. As has been noted through the years,
``one man's noise is another man's physics''! The argument is made that
these short-lived modes are part of the means whereby mechanical
oscillatory energy is
converted to thermal energy. The process can be understood qualitatively
by the triangle shown in Fig. 5.
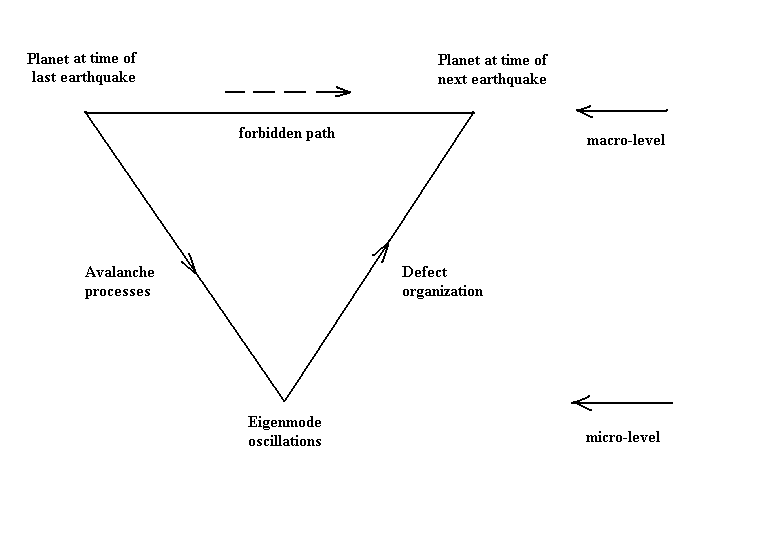
Figure 5. Modified Erber `Phonon Triangle' - a mechanism for the
generation of earthquakes.
As noted in the figure, earthquakes cannot happen without eigenmode precursors; i.e., the upper horizontal path is forbidden. The mechanism of `failure' is analogous to the fracture of a metal becaue of fatigue, by means of periodic strain, that doesn't necessarily have to exceed the elastic limit. The cascades (avalanches) of the downward path are well known to engineers and materials scientists. The upward path of defect organization is virtually unknown. It is part of the world of internal friction, for which science has no first principles understanding [7].
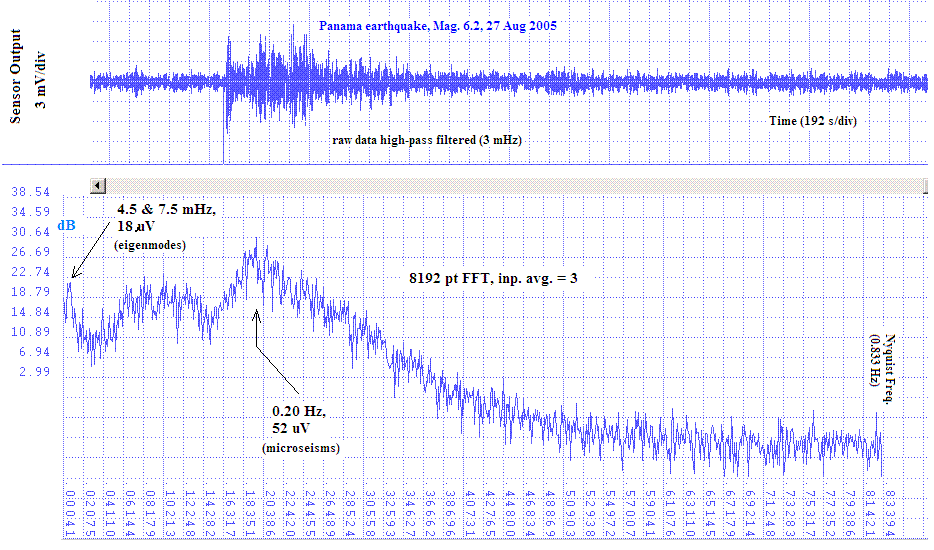
Figure 6. Record showing eigenmode oscillations as well as
(i) large microseisms, and (ii) a spectral contribution typical
of earthquakes
during the Gulf of Panama earthquake of 25 Aug 05.
The doublet at 4.5 mHz and 7.5 mHz is far enough above noise to squelch arguments that this is a meaningless `spectral transient'. Though not considered for this first case, following cases consider the lifetime features of similar modes.
Shown in Fig. 7 is a record that was collected with a pendulum [8] at the time the eye of Katrina was just off the continental shelf of the Gulf of Mexico. The discontinuity in water depth at this position is expected to have been especially significant. From considerations of similar records collected during earlier hurricanes, the author proposed the friction excitation mechanism for the generation of eigenmodes (analagous to the singing rod). The westerly winds of the storm south of the eye, blowing over deep water, would be much less important than the easterly winds north of the eye blowing across the shallow waters of the continental shelf. In addition, of course, strong outer bands of the storm were at this time blowing over land.
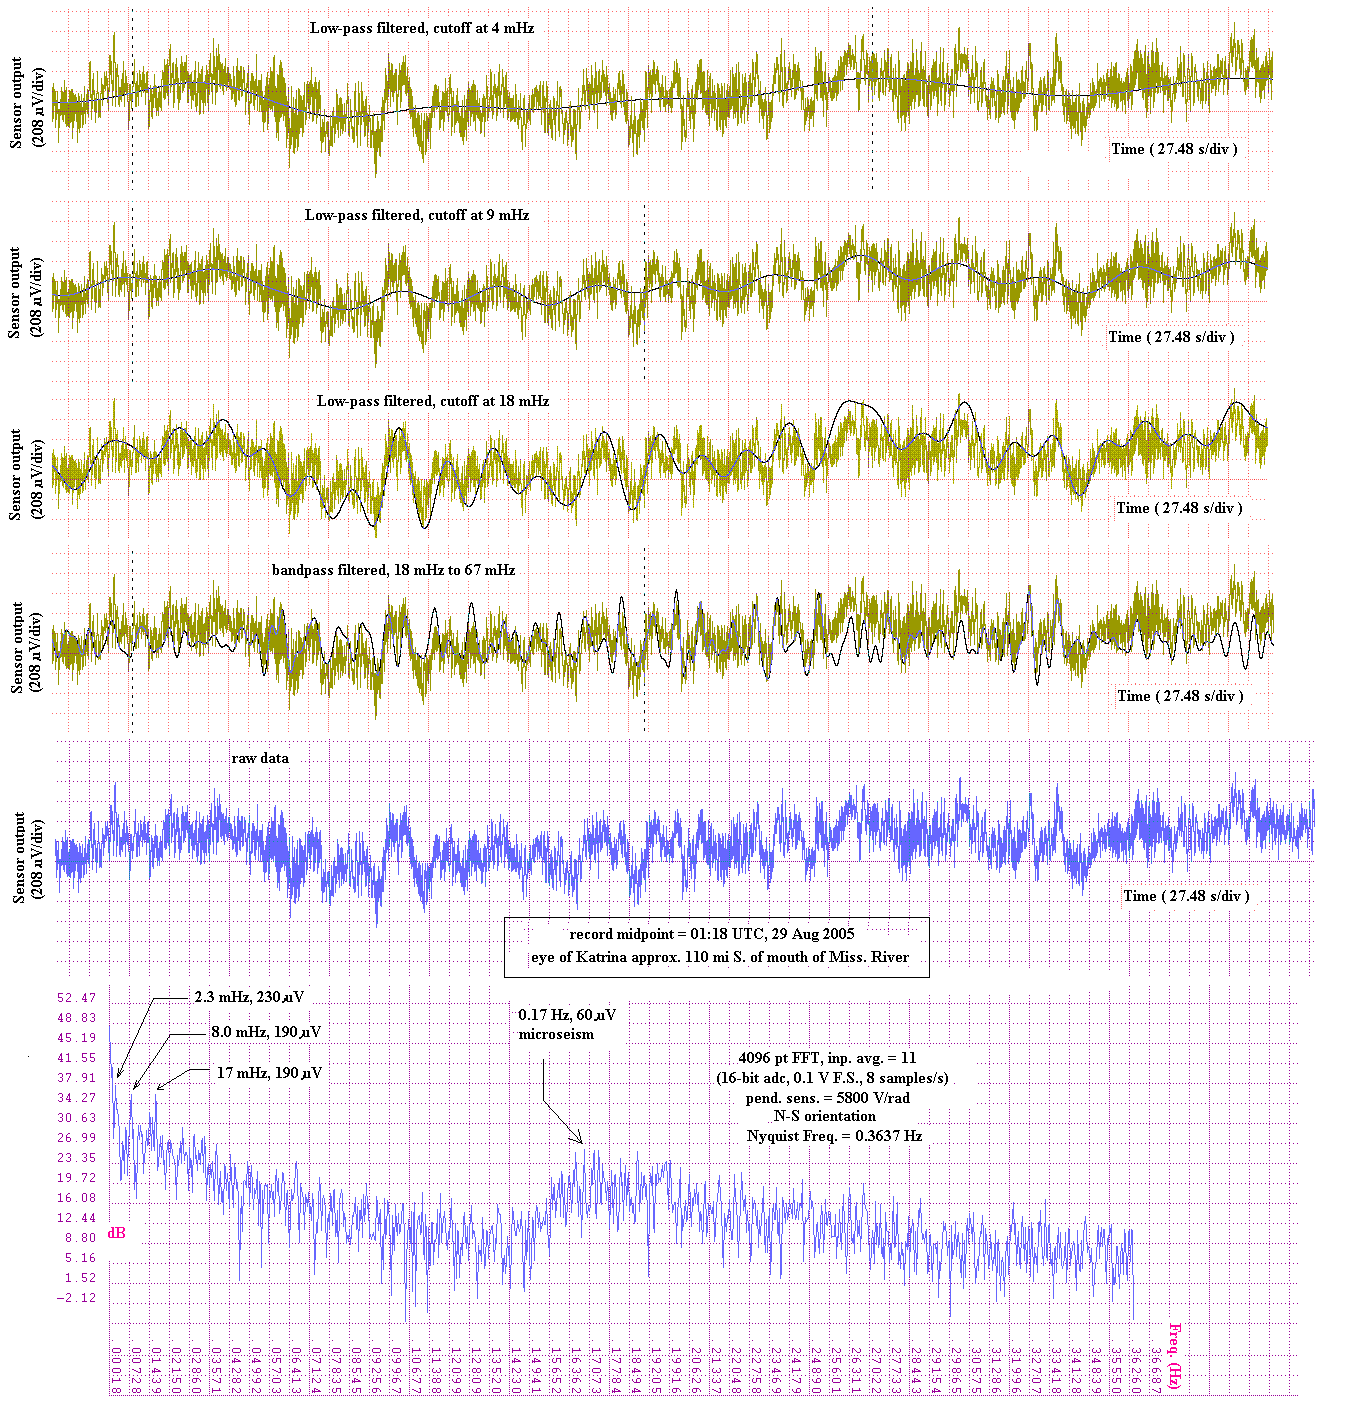
Figure 7. Eigenmode oscillations resulting from
hurricane Katrina's interaction with the continental shelf of the
Gulf Coast. Data recorded with a conventional pendulum seismometer.
Katrina possessed another means for exciting oscillations of the Earth. The pressure in the eye of the storm was very low at this time, so passage of the eye across structural changes of the earth should result in an impulsive type vertical disturbance. Shown in Fig. 8 is what is thought to be an example of this mechanism, as the eye of the storm was beginning to cross the Gulf Coast.
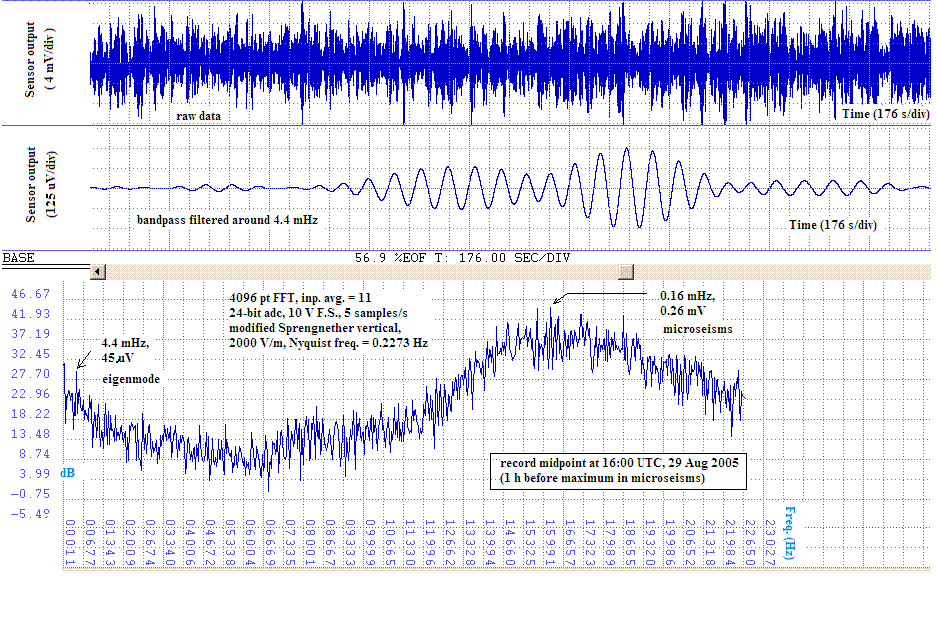
Figure 8. Eigenmode oscillation observed with the modified
Sprengnether vertical seismometer as the eye was about to cross
the Gulf Coast.
Shown in Fig. 9 are a sequence of spectra that `straddle in the time' the storm's crossing of the Gulf Coast; the total duration of the 21 cases is 16.2 h with a Dt = 48.64 min between adjacent records.
There are several features of special significance to note from fig. 9. First of all, a pair of step-decreases of peak intensity are observed; the first downward jump was by 3.7 dB at t0+14dt, and the second by 1.8 dB at t0+18dt. No explanation for their cause is presently offered, except to note that this author has observed similar `quantal' changes in the oscillatory energy of laboratory-scale mechanical oscillators.
The second feature is one that supports the phonon-triangle model of Fig. 5. In the early plots there is very little energy in the modes whose frequencies lie below the microseismic peak at about 0.18 Hz. As time progresses, there is a buildup of energy in these lower modes, as the magnitude of the 0.18 Hz peak diminishes. This is consistent with motion along the upward leg of the phonon-triangle, associated with defect organization. A complex process involving nonlinear internal friction, no theories of first-prinicipal type have yet been developed to describe such phenomena [7]
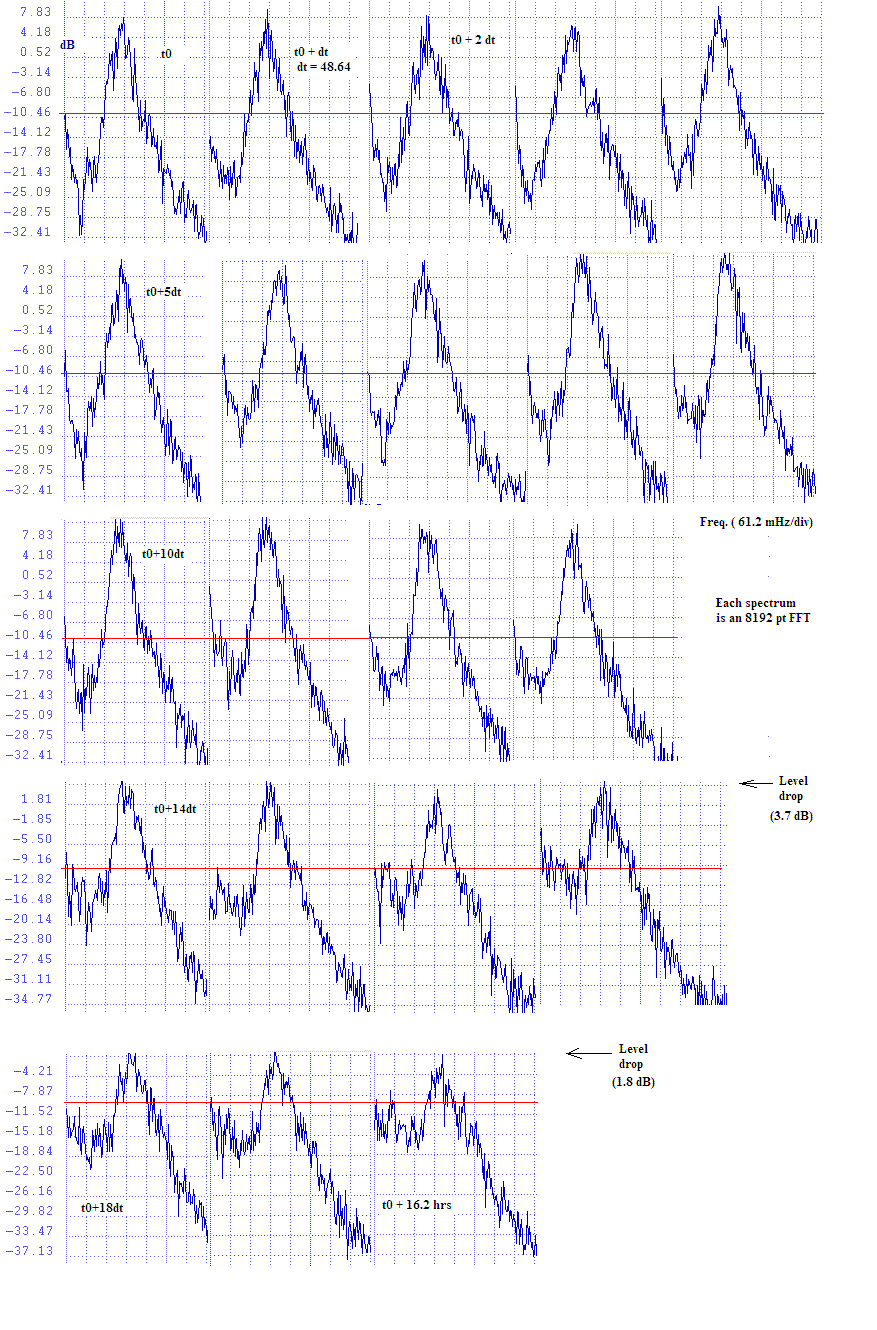
Figure 9. Evolution of the microseismic spectrum as Katrina
crossed the Gulf Coast. The reference (red) horizontal line is
positioned at -10 dB for every graph.
There are two especially interesting cases in Fig. 9. At both t0+16dt and t0+20dt (last graph), `pedestals' with widths of about 15 to 20 mHz are seen; the first with midpoint near 38 mHz and the second near 50 mHz. These midpoint frequencies lie in the range customarily associated with surface waves (Rayleigh and Love) from teleseismic earthquakes. This author has never observed surface waves from earthquakes that were distributed over a broad range of frequencies like this.
Let us now estimate the power in some modes to show that the hurricane and/or earthquake were easily powerful enough to sustain them. Consider the eigenmodes shown in Fig. 7, at 2.3, 8., and 17. mHz. We base the calculations on pendulum dynamics analogous to Eq.(3) with an assumed shape factor of unity (worst case scenario, refer to Fig. 1). For these three eigenmodes we obtain respective powers of 0.5, 1.1 and 2.3 ×10⁹ W. Any of these is small compared to typical hurricane powers, which are estimated to lie in the range from 0.5 to 2×10¹⁴ W [9].
Unlike the `boomer' modes following large earthquakes, the modes being presently described are shortlived, and only this author has engaged in extensive studies of them. The energy expended during the lifetime of a mode is estimated roughly on the basis of its nominal lifetime, rarely greater than a dozen cycles. Thus, for the three modes just mentoned, one finds from Fig. 7 that they are roughly 3, 10, and 10 cycles in duration, respectively. This yields then a rough energy estimate for each of the modes of about 1012J. Previous work by this author suggests that the distribution of energies in the earth's eigenmodes may be generally `flat' over a surprisingly broad range. This is consistent with the 1/f 2 `noise' that is observed in broadband seismic studies. What the seismologists call noise, this author prefers to view as a `goldmine' of unstudied earth physics. Few instruments other than those with detectors similar to that of the modified Sprengnether or conventional pendulum used to collect the present data appear to be well suited to this type of experimentation.
Bibliography
[1] http://www.nasa.gov/vision/earth/environment/HURRICANE_RECIPE.html
[2] http://www.iris.edu/about/ENO/iows/8_2005a.htm
[3] http://en.wikipedia.org/wiki/2004_indian_Ocean_earthquake
[4] http://lasker.princeton.edu/ScienceProjects/curr/eqmag/eqmag.htm#activty_5._magnitudes
[5] ``Hurricane excitation of earth eigenmodes'',
http://arxiv.org/html/physics/0506162
[6] M. Kwon & R. Peters, ``The study of eigenmode types and
source nonlinearity in the free earth oscillations'', Saemulli Vol.
35, no. 4, 569 (1995).
[7] R. Peters, ``Friction at the mesoscale'', Contemporary
Physics, Vol. 45, No. 6, 475-490 (2004).
[8] ``Modernized conventional pendulum seismometer'',
online at http://arxiv.org/html/physics/0508028
[9] National Center for Atmospheric Research,
http://www.ucar.edu/news/features/hurricanes