Randall D. Peters
Physics Department, Mercer University
Macon, Georgia
Copyright February 2008
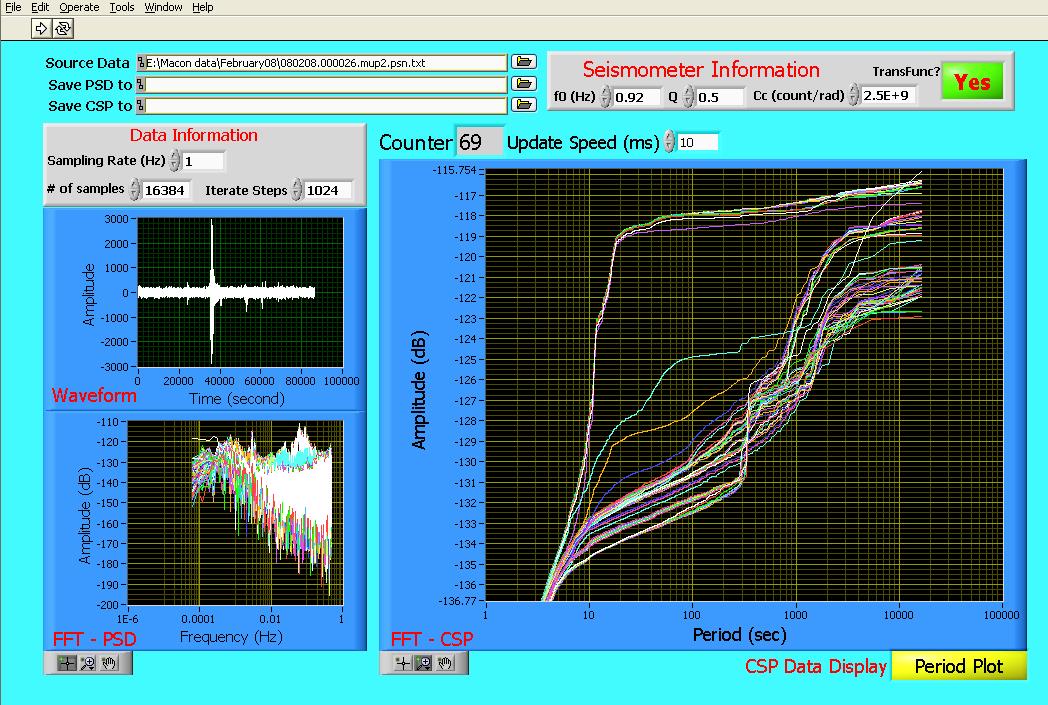
The cumulative spectral power (CSP) is an effective new tool for studying the evolution of earth motions. The CSP in the figure below was generated from data recorded with a VolksMeter in Macon, GA following the M6.9 earthquake that occurred on 8 Feb 2008 in the Northern Mid-Atlantic ridge.
Also shown (smaller insets) are (i) the 24-h time trace that near its center shows the obvious features of the event, and (ii) the power spectral density (PSD) graphs from which the CSP graphs were generated invidvidually by integration. As can be seen by comparison, the smoothing that results from integration makes the overlay of time-different CSP curves much less cluttered than the equivalent set of PSD curves. Consequently, the manner in which the spectral content changes with time is much easier to interpret.