Correlation measurements of Atmospheric Pressure
variations and Seismicity during Hurricane Dennis
Randall D. Peters
Physics Department
Mercer University
Macon, Georgia
July 2005
Abstract
During the passage of hurricane Dennis, two functionally different
instruments made continuous recordings from their location
in Macon, Georgia. These were
(i) a non-conventional vertical seismometer, and (ii) a low-level
differential
pressure sensor. Data were collected for 72 hours, beginning when
the eye of the storm was located in the vicinity of Key West, Florida.
Over the ensuing three-day period, fluctuations in the outputs from
the two instruments were found to be highly correlated, with the
exception of one eight hour interval.
1 Background
In a previous study it was shown that hurricane Charley not only
generated microseisms as many would expect, but it also at times
excited oscillations of some of the free-modes of our planet [1].
It was hypothesized that passage of the eye of a hurricane across
a region of the earth where there is a sharp change in
acoustic impedance, should result in a driving force for eigenmodes.
The forcing function is for this case the reduced pressure in the
eye of the storm.
If the above hypothesis is true, then one expects the
excitation of localized earth crustal motions to also generate pressure
disturbances in the atmosphere. Resulting waves should travel large distances
from their source and, at a given observation point, cause
pressure fluctuations of infrasonic type.
The present
study offers support for this conclusion by
demonstrating a strong correlation between the outputs from the
two instruments that were
monitored: (i) a modified Sprengnether vertical seismometer, and
(ii) a highly sensitive differential pressure detector invented
by the author.
2 Instruments
2.1 Seismometer
The seismometer is described in reference [1], except that for the present
study the (unconventional `weak') force-feedback described there
was not utilized.
In other words, the instrument was operated open-loop-a mode that is
thought by professionals of geoscience to be completely unacceptable!
The reason is that conventional professional seismometers use capacitive
sensors that are severely restricted in mechanical dynamic range. Thus
the standard modus operandus of these instruments is one involving
force-balance. A disturbance is monitored by means
of the error signal required to keep the mass of the instrument virtually
stationary.
As noted in ref. [1] and various other of the author's publications concerned
with internal friction [2], strong force-feedback of this type,
when coupled with the PID (proptional integral, differential) network
that is employed-severely restricts the low frequency performance of
the instrument.
The area-varying (as opposed to gap-varying) architecture of the author's
patented fully differential capacitive sensor [3] allows a much greater
mechanical dynamic range. In turn, this permits the seismometer to operate
open loop (without destruction of sensitivity) and allow the
non-ideal spring of the instrument to `find its
own best' equilibrium position, as it is being continuously
influenced by anelasticity responsible
for creep.
In previous experiments the open-loop mode was not feasible because
the ADC employed
was limited to only 16-bits (Dataq DI-700). For adequate low-level
sensitivity, the
rail voltage was set at +/- 0.1 V. For large earthquakes this value
was too low to prevent saturation of peak signals.
The present study used a Symmetric
Research single-channel ( » $100) converter having 24-bits,
so that the
rails could be increased to +/- 10 V. As seen in later graphs, this
permits open-loop diurnal voltage swings as large as 1 V to be accommodated
while signals at the 1 mV level (such as by distant earthquakes) can
still be resolved. Most large earthquakes should also be observable
without waveform clipping.
Seismologists are accustomed to viewing `velocity' output as opposed
to the `displacement' output of the present instrument. If one
insists on working with the former, it is a simple means to take the
numerical derivative of the filtered records. To collect the raw data
as velocity rather than displacement causes the signal at low frequencies
to be attenuated 20 dB per decade. Though commonly practiced,
this severely restricts an instrument's ability to study the most
interesting eigenmodes of the earth.
2.2 Pressure Sensor
The pressure sensor operates as a gap-varying fully differential
capacitive detector that uses a diaphragm. The principle of its operation
is described in the patent literature of [3]. The diaphragm is
fabricated from thin aluminized
mylar held in tension.
The static plates on either side of the diaphragm were
fabricated from printed circuit board material. As manufactured
and sold by
Tel-Atomic Inc. (no longer available), the sensor was operated with
their SDC electronics box.
For the present work this box was replaced with an autozeroeing electronics
package designed by the author for use in a planned, inexpensive earthquake
detector [4]. The `return to zero' time constant
is about 20 s. This limits the low frequency response of the instrument;
in a Bode plot, the falloff occurs at a value
close to the lower corner frequency
of early-generation seismometers referred to as `long-period' type.
The sensitivity of this differential pressure instrument was estimated
» 100 mV/ Pa. For the noise level of the electronics
this yields a resolution significantly less than one part per million
of atmospheric pressure.
This is much smaller
(about two orders of magnitude) than the resolution
of a typical barometer. Barometers are absolute pressure instruments,
and their resolution is limited by friction effects, whether internal
to their more massive diaphragm, or Coulomb friction (older mechanical
instruments) in the mechanism used
to communicate diaphragm strain to a recording indicator.
3 Method of differential-pressure measurement
One side of the diaphragm is open to the atmosphere. The other side
communicates through a tube to a bottle. The bottle is housed in
a thermally insulated container, so that temperature fluctuations
are minimized. With ideal electronics, the lower corner frequency is
determined by the leak rate of the bottle.
This rate determines the properties of this mechanical high-pass filter.
Even if the electronics of the instrument was not low frequency limited
as mentioned earlier,
this method of measurement would still place a limit on the maximum
period of pressure variation that could be detected.
4 Results
4.1 Pressure data
The two instruments were not co-located, but rather separated in
distance by two miles. The pressure sensor was located in
the Willett Science center of Mercer University and the seismometer
was located in the quieter location of the author's home basement.
Shown in fig. 1, for the pressure sensor, are two days worth of temporal data
from the three-day recording session. Indicated with the red arrows
are various places where coherent oscillations were found by using
Dataq's frequency-domain software [5]. When present, these oscillations
in the range from 5 to 13 mHz must be large, since electronics attenuation
has reduced them by a factor of about 25 dB (rough estimate).
An example oscillation is provided in fig. 2. The decibel scale for
this graph differs (subscript `D' for Dataq) from the other
cases of this paper. It is referenced to the full scale (10 V) gain
setting of the 16-bit ADC (DI-700). To convert a dBD value to the
conventional scale, one simply uses (for this gain setting)
dB = dBD - 70.31.
The convenience of the Dataq software makes easy the task of finding
oscillations
in the pressure data, by locating spectral lines after FFT
calculation with a Hanning window. Different regimes of frequency
require different `compression', which Dataq refers to as `input
averaging'. Exploration is straightforward by means of rapid `mouse click'
transformations between the time and frequency domains.
Once a line is identified, the raw data can be manipulated by a variety
of filter possibilities, such as the bandpass capability
employed for fig. 2. Uncorrected for electronics attenuation, the
5.3 mHz oscillation level, at 47.5 mV; corresponds to a pressure
amplitude of approximately 0.5 Pa. In units common to meteorology this
is 5 mbar, 5 parts per million of atmospheric pressure. For
comparison, the pressure in the eye of Dennis at this time
was estimated from NOAA advisories to be about 960 mbar; i.e., a
deficit relative to std pressure of 53 mbar.
Just as oscillations were easily discovered in the pressure
data, so oscillations could also be easily found
in the data of hurricane Charley [1]; since a Dataq ADC was also used
with the seismometer for that study. Unfortunately, such ease is not yet
available for the present seismic data, which was collected with the
ADC sold by Symmetric Research; the output of which was analyzed using
QuickBasic generated code
written by the author. Because of the user `unfriendliness' of
this software (severe as compared to the Dataq algorithms)
no serious effort was mounted to try and find
similar oscillations in the records generated by the
seismometer.
If such oscillations could be
located and shown to correlate in both frequency and time with the
pressure data, such a discovery would lend even greater support to
the present hypotheses.
In addition to the oscillations noted in fig. 1, a number of
prominent features
are evident within the time-varying level of the signal.
The discussion of these is postponed until
later graphs, where the same features manifest themselves in
data from the seismometer.
4.2 Seismic data
Instead of plotting seismic temporal data in the manner of
the pressure results of fig. 1, the seismic results are given in terms
of frequency plots as a function of time. These display
spectral evolution as hurricane Dennis interacted with various
land masses. For example, a noteworthy graph is that of fig. 3, labeled
in time as 9.1 h. From the Advisory Archive data provided by
NOAA's National Hurricane Center, it was
determined
that the eye of the storm was at this time located near the edge of the
continental shelf west of Naples, Florida. As with hurricane Charley,
Dennis grazed a continental shelf. With Charley the
grazing produced a pronounced disturbance in both the seismic
time and frequency
plots. In the present case with Dennis, only the spectrum
appears to change significantly during this shelf interaction. The
transient appearance at this time, of a lower frequency `hump' in
the spectrum,
is thought to be consistent with the short-lived 12.9
mHz oscillation that occurred in the pressure data at this time
(refer to fig. 1).
In the majority of the graphs of figures 3 through 5 there is an
unmistakeable presence of microseisms-the sawtooth structure
with a peak typically near 0.2 Hz. This structure is very nearly the
same as was observed with Charley when the eye of the storm was
located in the Gulf as opposed to the Atlantic. As noted in [1],
the difference in character
is attributed to ocean depth
differences.
5 Earthquakes
Three earthquakes were large enough to be obviously
registered by the seismometer
during the three days of data collection. In each
case they show a spectral feature with frequencies lower than that of
the microseisms, as seen in figures 3 through 5. In figure 3, time-case
13.6 h, the structure labeled with the question mark
may or may not be associated with
quakes in Japan and Indonesia.
Records from USGS do
not show a sizeable earthquake
that could have been responsible for the hump that is attributed to
interaction of hurricane Dennis with the continental shelf.
To illustrate the significant difference between the present seismometer
and conventional instruments, fig. 6 provides the time
and spectral signatures of the Easter Island earthquake.
6 Correlation
A strong basis for the claims of this paper (including those of ref. [1]) is
found in the results shown in fig. 7. Surprisingly strong correlation
between
seismometer output and pressure sensor output is seen to occur
everywhere except for the short segment that was excised before doing
the right-side correlation plot. With a correlation coefficient
(R2 from the
linear fit) of nearly 80%, there is evidence for significant coupling
between ground motion and atmospheric dynamics.
For fig. 7 the seismic data was high-pass filtered. Motions with periods
greater than about 200 s were suppressed as follows. After
reading each individual
record of length 1024 binary-data-words (sample rate 5 per s), both mean
value and linear
trend were numerically removed using Excel. By concatenating every
fifth value of these
adjusted records in
a composite of length 4096 s , the frequency
regime of the seismic data and the pressure data were
more closely matched. The effect of this unconventional filtering operation
can be appreciated by comparing the earthquake data of fig. 8 (Fiji Island)
with that of fig. 6 which used no filtering. In particular, notice the
difference in the spectra.
All spectra shown in this paper were calculated using the FFT algorithm
of Excel [6]. The artifact shown in the spectrum of fig. 8 is not
due to any anomalous behavior of the excel software. Rather it results
from the concatenation of segmented records (filtering process
mentioned earlier, in which mean
and trend were removed from each of the individual segments).
If the low frequency information in the seismic
data is not removed, then
some of the `event' features are even more pronounced, as seen from fig. 9.
Here the double hump associated with grazing of the continental shelf
is dramatic. The two other humps are also reasonably explained; i.e.,
when the
eye (i) hit the gulf shore and when it was (ii) closest to the instruments
located in Macon, Georgia.
6.1 Anomalous segment
The reason for legitimately excising the segment (left-side) of fig. 7
from the correlation plot can be understood as follows.
During this time the storm was responsible for considerable turbulence
in the
Macon area.
For example, a close neighbor's house was the only one
severely
damaged by a huge sweetgum tree that was broken by strong winds
at its half-height point.
The influence of such localized turbulence is of much greater influence
on a pressure sensor than it is on a seismometer. Its small
spatial extent is incapable of greatly disturbing
the ground.
7 Arrival time issues
In the correlation analysis the pressure and seismicity data were adjusted
timewise to maximize the correlation coefficient. It was observed that
peaks of the pressure data preceded those of
the seismic data in all cases by a couple of hours. Explanation for
this arrival time difference can probably be understood in detail only with
additional experiments involving more than one pair of sensors, preferably
an array of sensors. It is thought that the pressure variations are
the result of buoyancy waves that travel at much lower speed than seismic
waves responsible for the seismometer response. Thus the tardiness of
the seismic data suggests that the origin of excitation is different for
the two. In particular, it is deduced that the pressure data derives
mainly from the outer bands of the storm (between eye and sensors), whereas
the seismometer data derives from its eye. Because the outer bands
encounter a land discontinuity before the eye gets there, the pressure
should be first
to announce the encounter.
References
- [1]
- R. Peters, ``Hurricane excitation of earth eigenmodes",
online at http://arxiv.org/html/physics/0506162
- [2]
- see, for example, R. Peters, ``Damping'',
chapters 20 and 21,
Vibraton and Shock Handbook, CRC Press, 2005,
and also
R. Peters, ``Friction at the mesoscale'', Contemporary Physics,
Vol. 45, No. 6, 475-490 (2004).
- [3]
- Symmetric differential capacitive (SDC) sensor, U. S. Pat. No.
5,461,319. Online information is available at
http://physics.mercer.edu/petepag/tutorial.html
- [4]
- ``An affordable earthquake detector'', Popular
Science, p. 104, April (2005).
- [5]
- From exploratory analysis of frequency domain features of
a record, using the *.wdq files generated by a Dataq ADC.
- [6]
- Examples of the use of Excel's calculation of FFT's is to
be found in the article by R. Peters, ``Spreadsheet filtering by
FFT Gaussian-based Convolution'', online at
http://physics.mercer.edu/hpage/filter/gauss.html
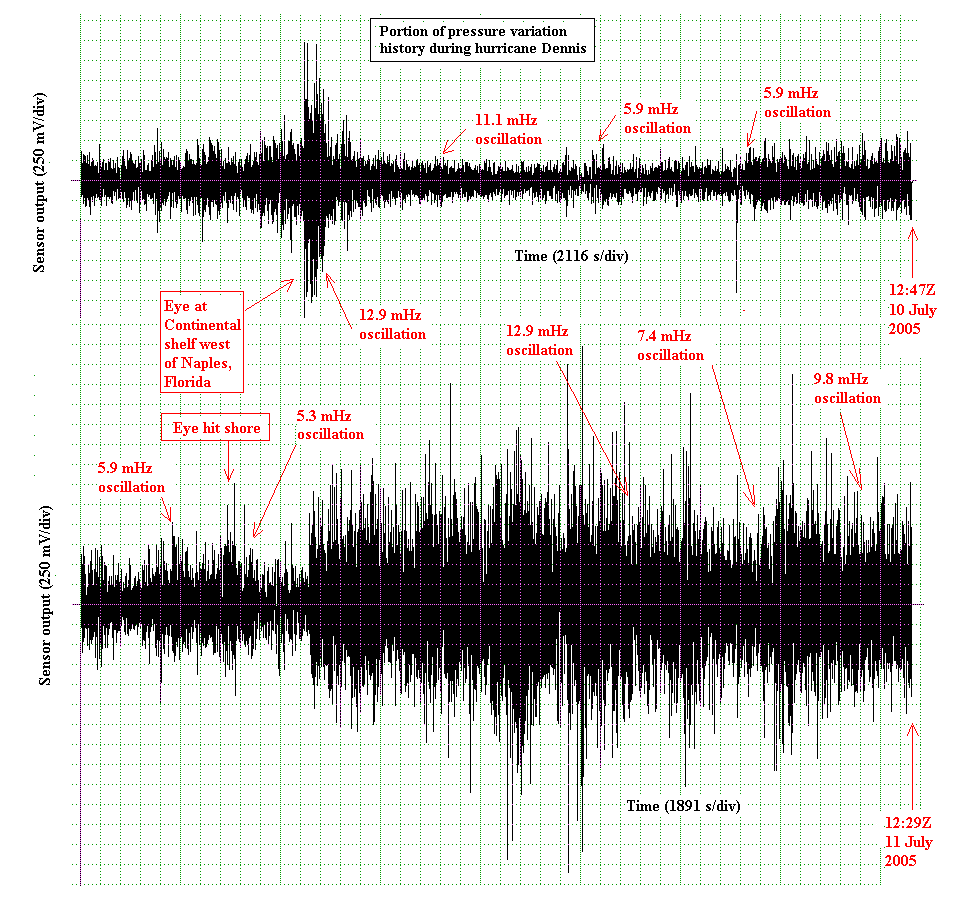
Figure 1:
Pressure vs time for two of the three days of recording.
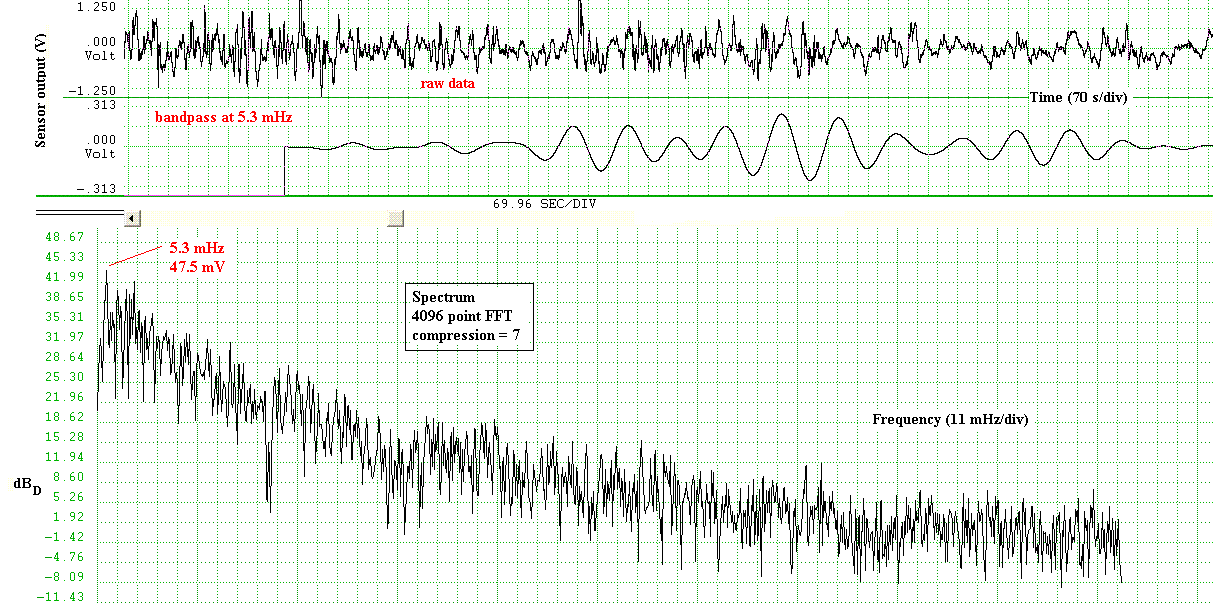
Figure 2:
Oscillation thought to be triggered by passage of the eye onto shore.
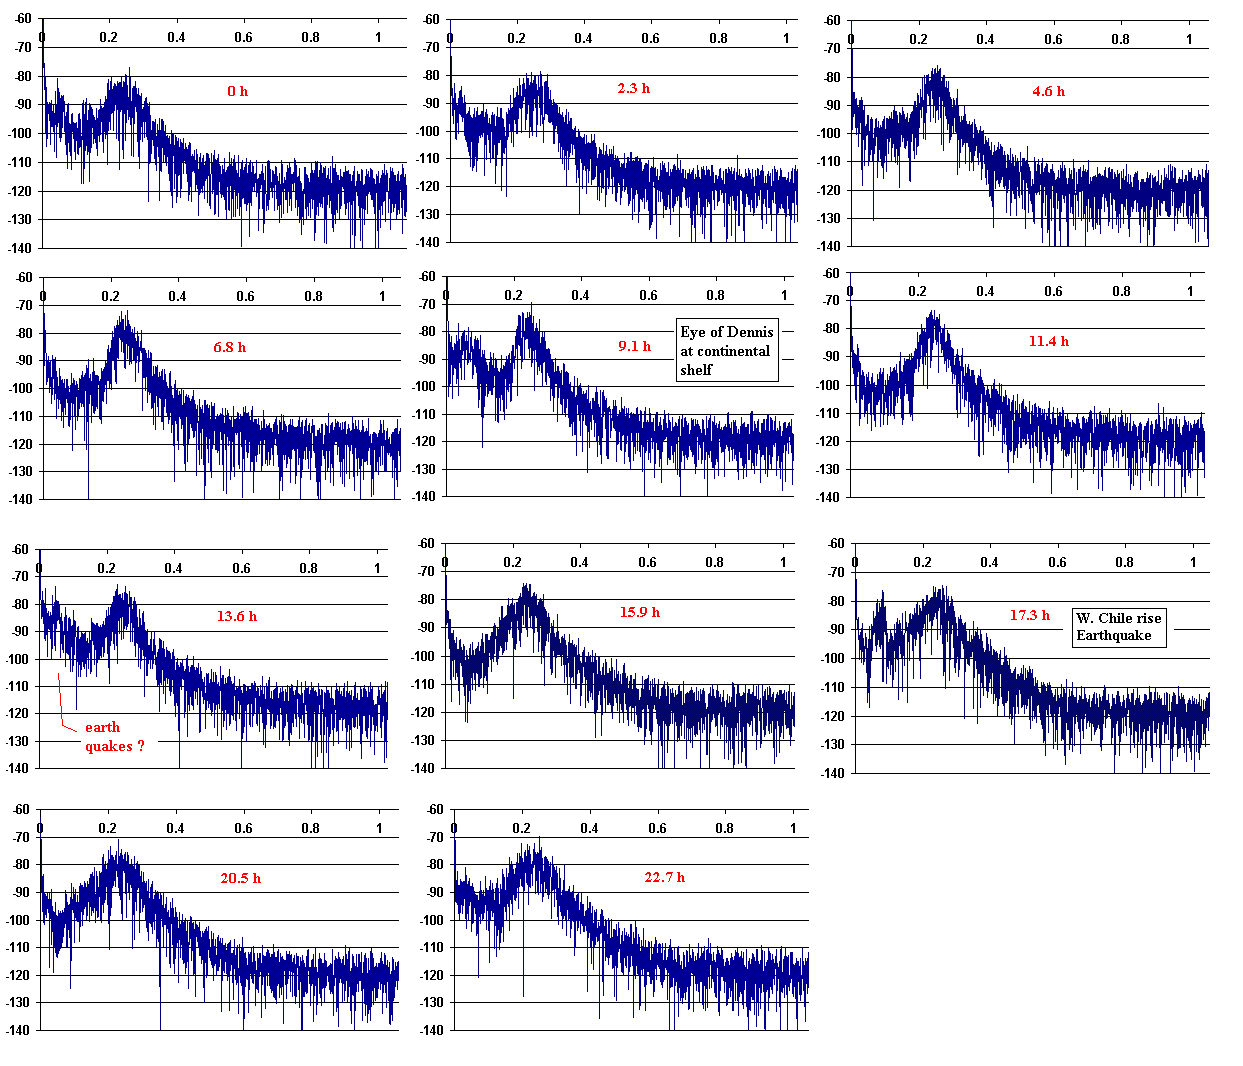
Figure 3:
Seismogram spectral characteristics the first day.
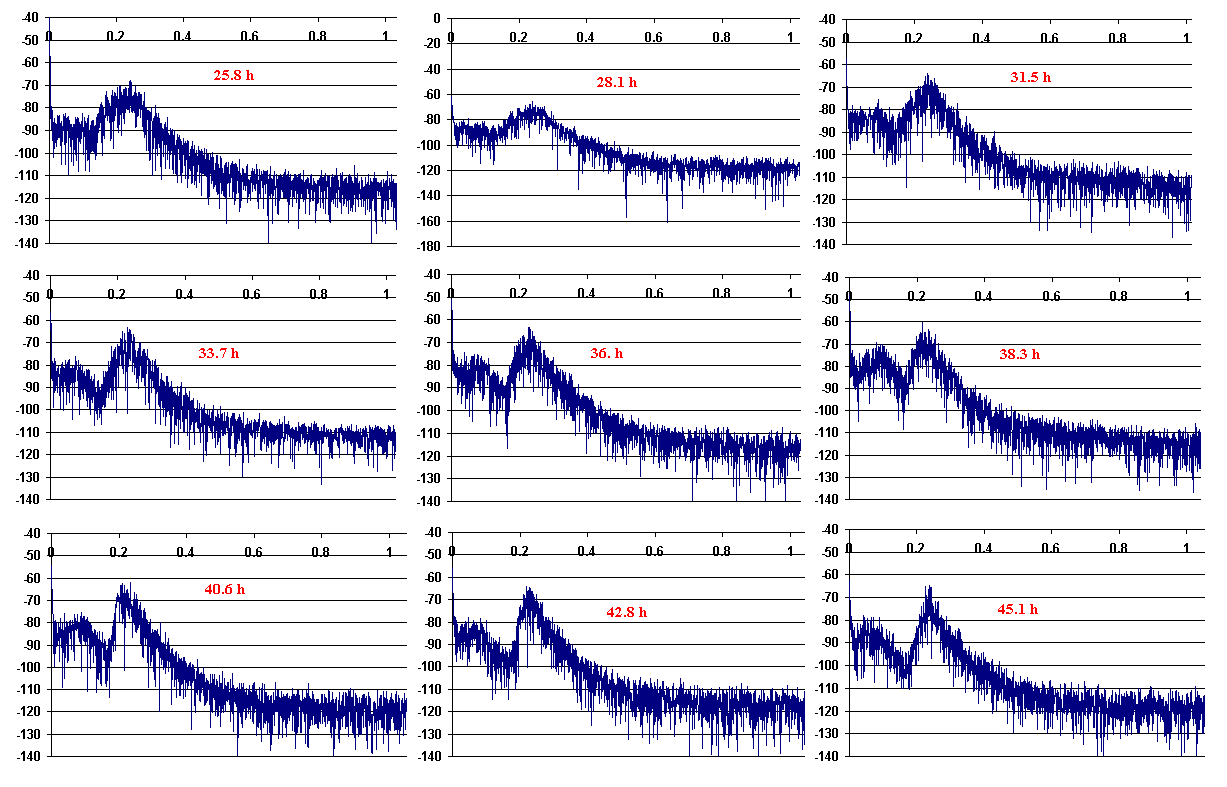
Figure 4:
Seismogram spectral characteristics the second day.
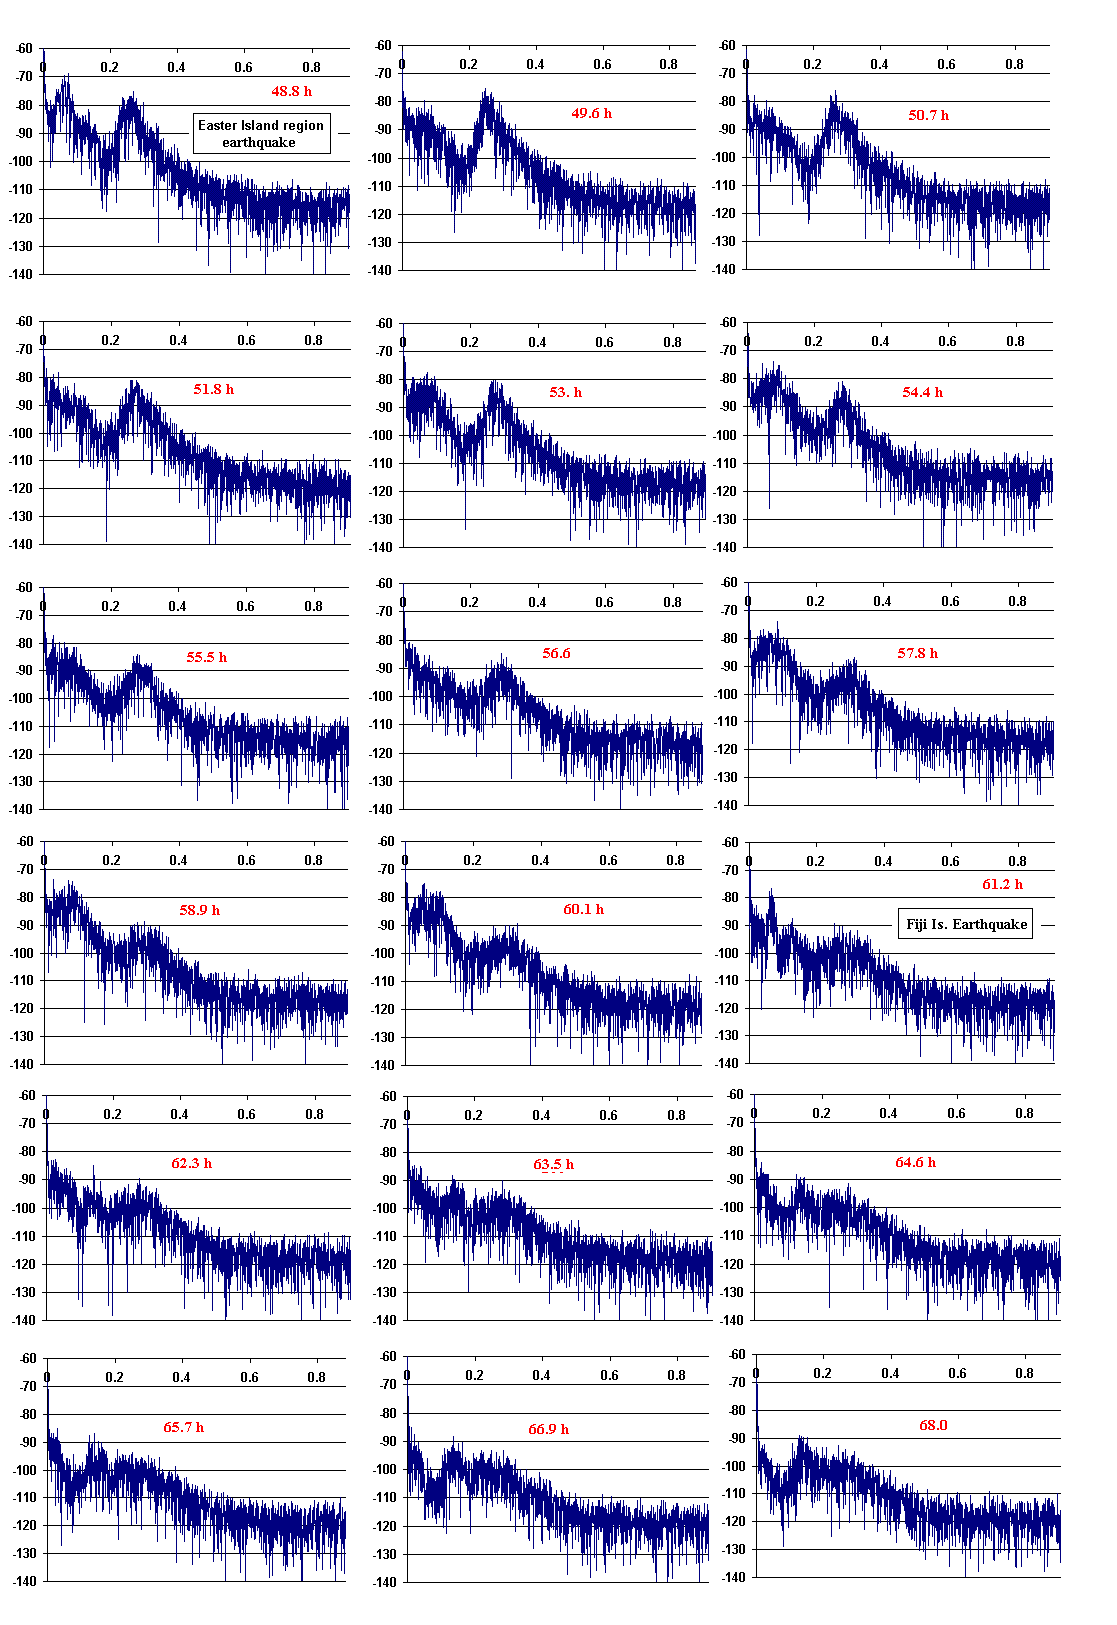
Figure 5:
Seismogram spectral characteristics the third day.
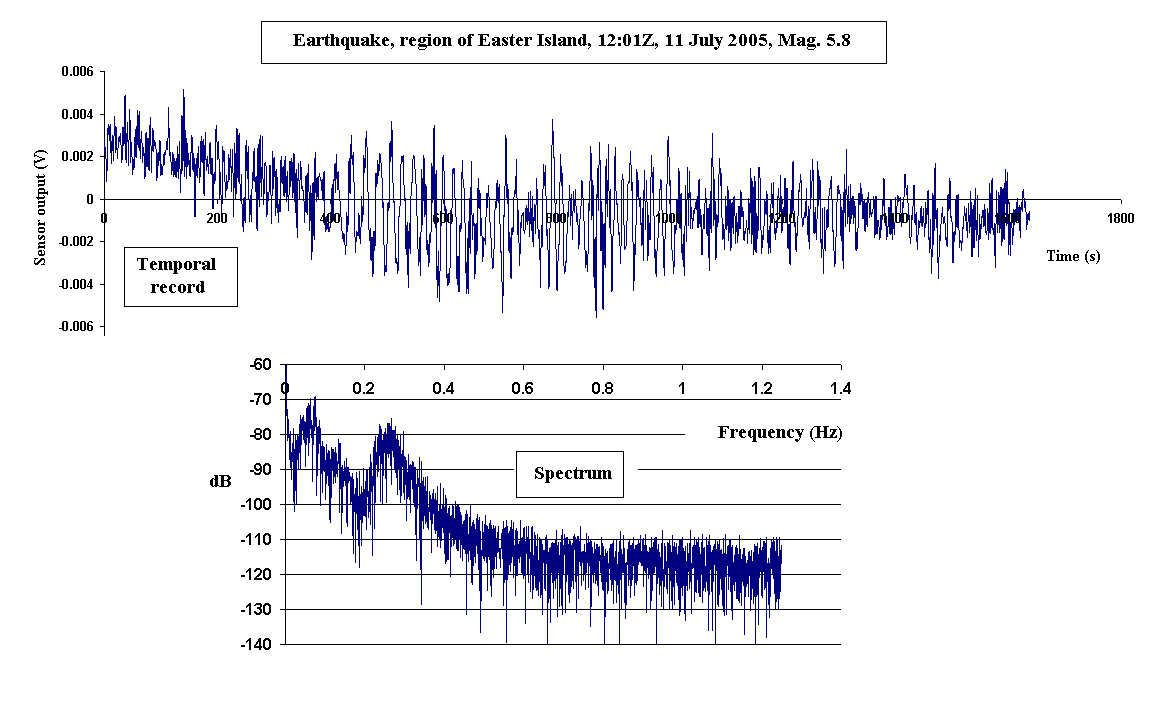
Figure 6:
Records from the Easter Island earthquake that occurred at
12:01:35 UTC on 11 July 2005.

Figure 7:
Correlation of fluctuations from the pressure sensor and the seismometer.
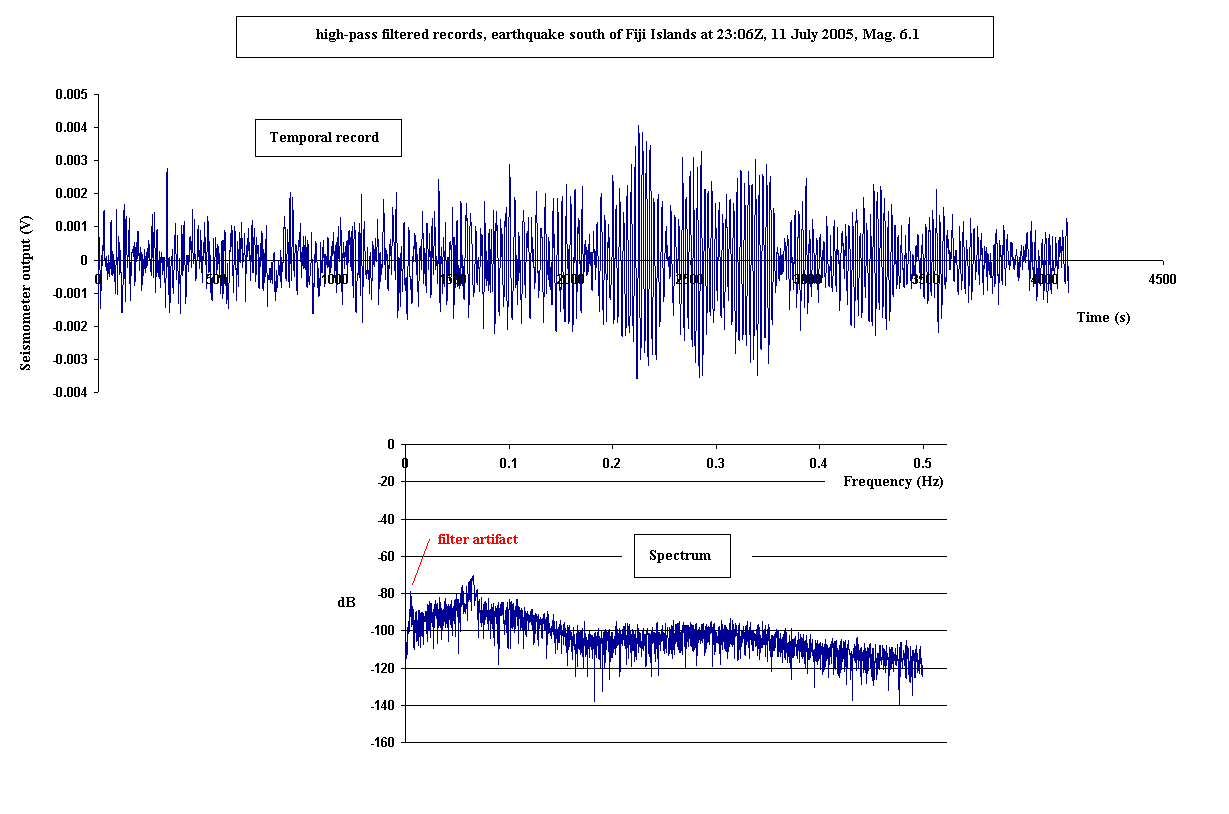
Figure 8: Fiji Islands earthquake; observe that the filtering
technique has introduced a numerical artifact (line with frequency of
5.2 mHz).
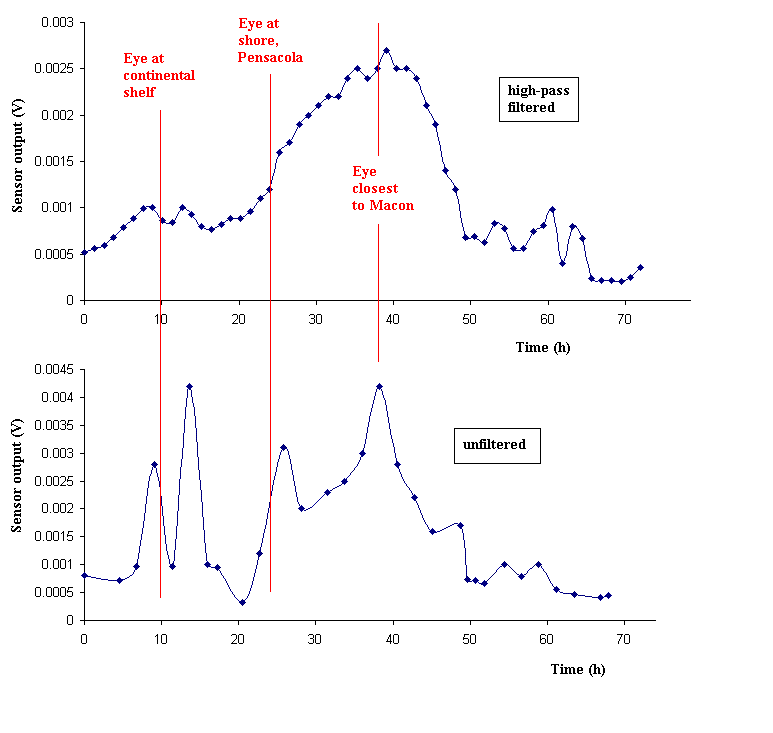
Figure 9:
Comparison of seismic fluctuation data after filtering (top) and
without filtering (bottom).
File translated from TEX by TTH, version 1.95.
On 16 Jul 2005, 12:30.


