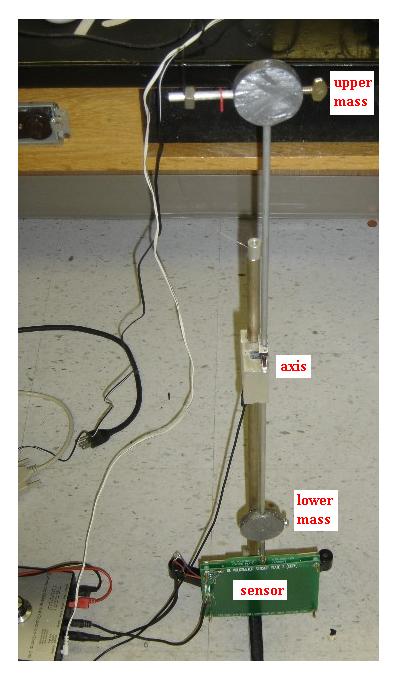
Figure 1. Photograph of the compound pendulum having a period of 4 s. The natural frequency of the undamped instrument is thus a reasonably close match to the peak frequency of primary microseisms.
Randall D. Peters
Physics Department
Mercer University
Macon, Georgia 31207
(Copyright October 2006)
For microseisms there is not a similarly great need to easily time-resolve specific attributes such as the arrival time of p and s waves used to determine distance of an earthquake from the sensor. Because the primary microseisms are localized in frequency in the vicinity of 0.25 Hz, it is therefore meaningful to take advantage of the response magnification of an undamped pendulum with reasonably high Q.

Figure 1. Photograph of the compound pendulum having a period
of 4 s. The natural frequency of the undamped instrument is
thus a reasonably close match to the peak frequency of primary
microseisms.
The axis of the pendulum is a pair of small tungsten carbide balls (taken from writing pens) resting on sapphire plates. Grounding of the rod, the bottom of which holds the moving electrode of the capacitive sensor, is accomplished by means of a long, coiled, small diameter copper wire.
The position sensor is a four-element array-form of the symmetric differential capacitive sensor patented by the author. It is one form of the first fully-differential capacitive detectors [1].
The instrument shown is of a type that has been extensively used by the
author to research internal friction [2]. As the period is lengthened
by raising the upper mass (and thus causing the center of mass to
approach the axis), the sensitivity to high frequency disturbances
decreases in accord with Fig. 2.
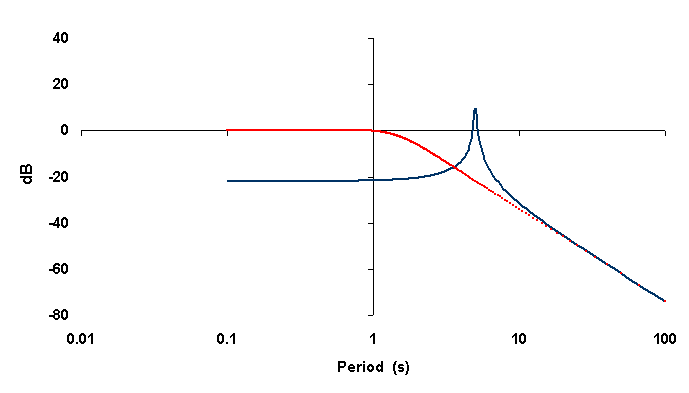
Figure 2. Bode plot showing response of the undamped compound pendulum
(blue) with period 4 s, Q = 40, compared to a
horizontal seismometer having a
period of 1.1 s and Q = 0.8 (red).
The dB ordinate is defined as 20 times the log to the base 10 of the ratio of the steady state amplitude of the pendulum to the amplitude of earth harmonic motion. It is seen that only a modest Q = 40 raises the sensitivity of the instrument dramatically for purpose of observing microseisms. Coupled with this is a significant reduction in high frequency sensitivity, which is the dominant realm of local noise sources. Thus the instrument's signal to noise ratio for detecting primary microseisms of 4 s period is expected to be exceptional.
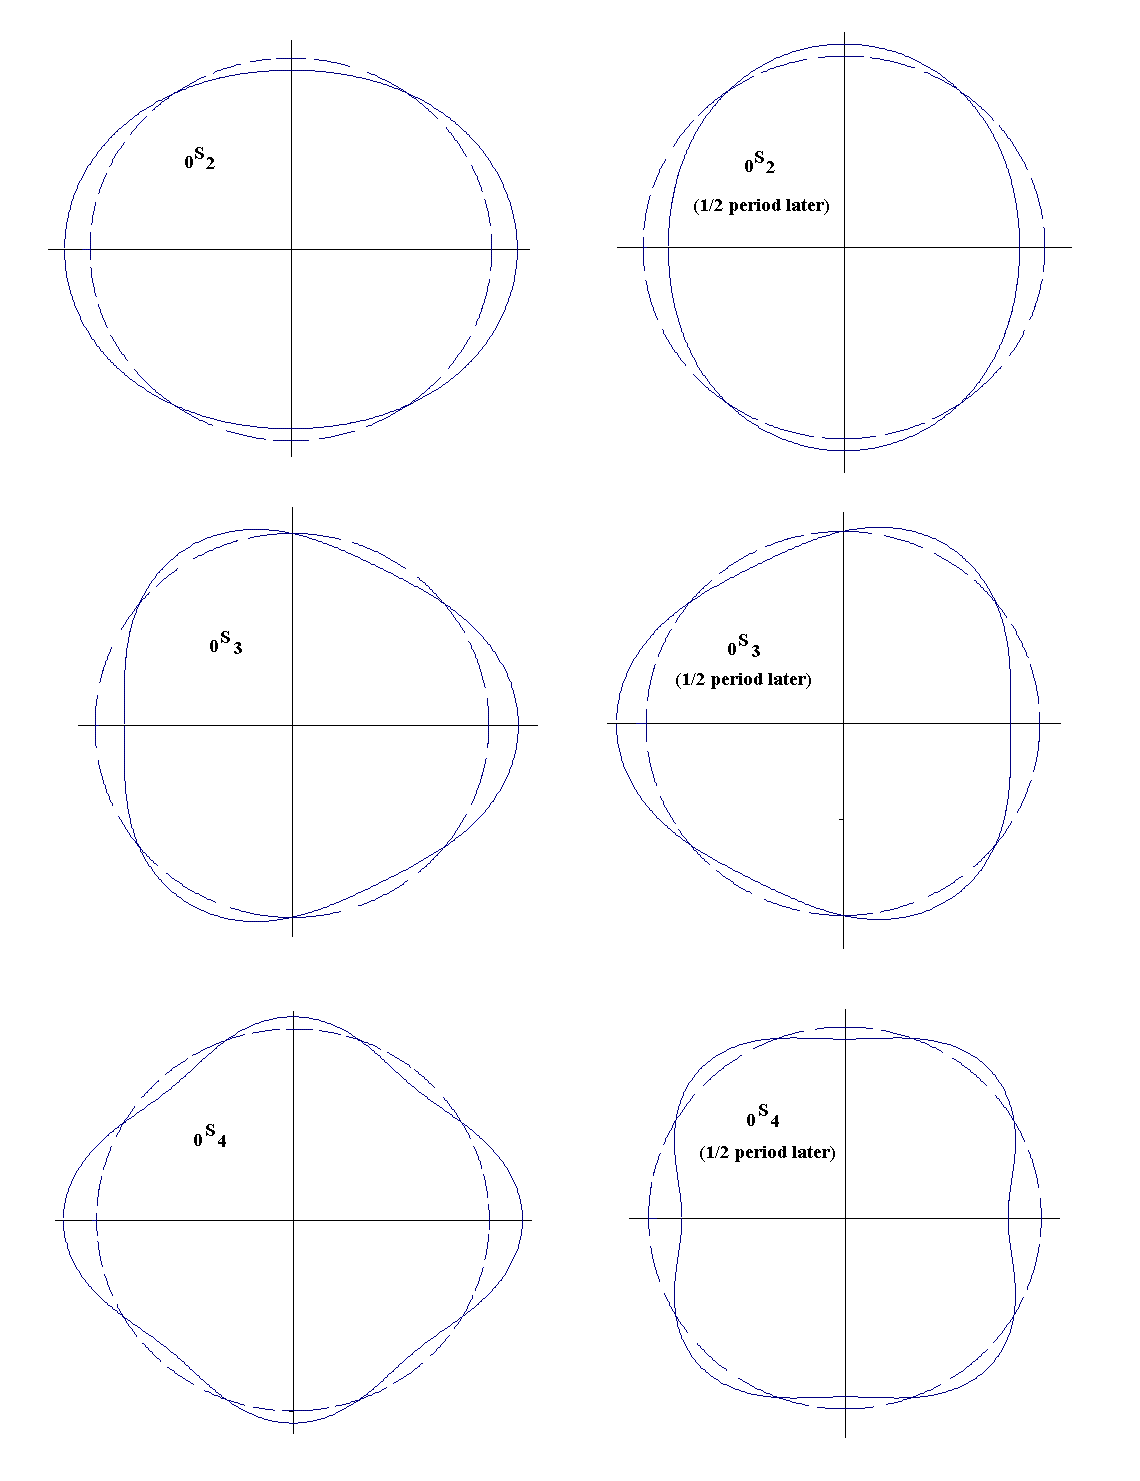
Figure 3. Illustration of eignemode oscillations of an
assumed spherical earth corresponding
to pure spherical harmonic modes.
To the present, only the author has exploited this powerful new means for studying our planet.
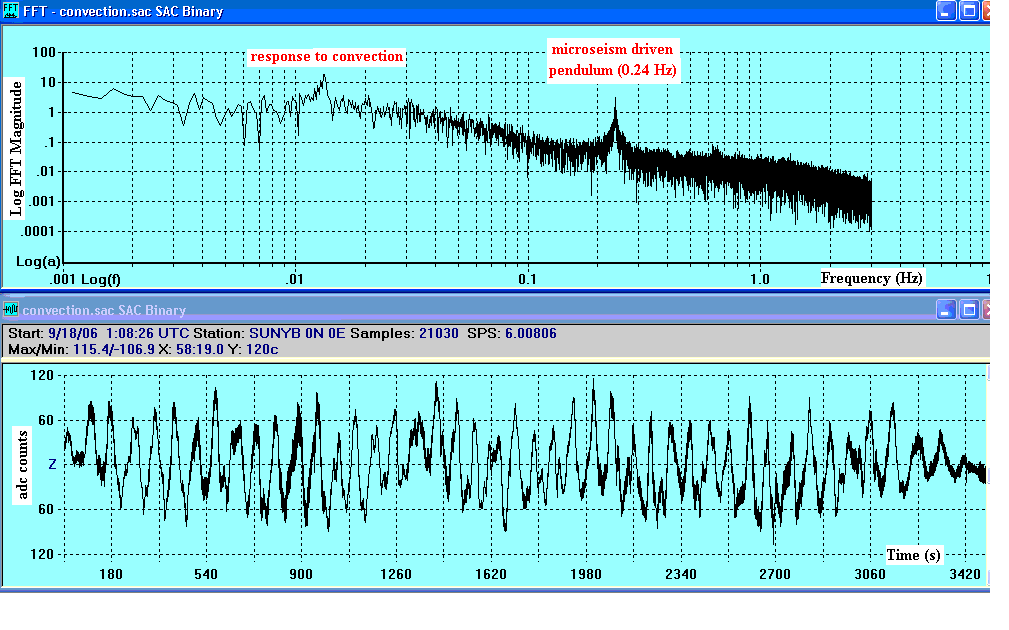
Figure 4. Example of troublesome convection response due to thermal
gradients in the air of the enclosure.
The convection was eliminated by shining a light bulb on the top of the metal garbage can used as the top part of the two-part enclosure. The lower part is a cylindrical portion of a fixed nylon barrel; off which the can is easily removed/replaced for purpose of adjusting the pendulum.
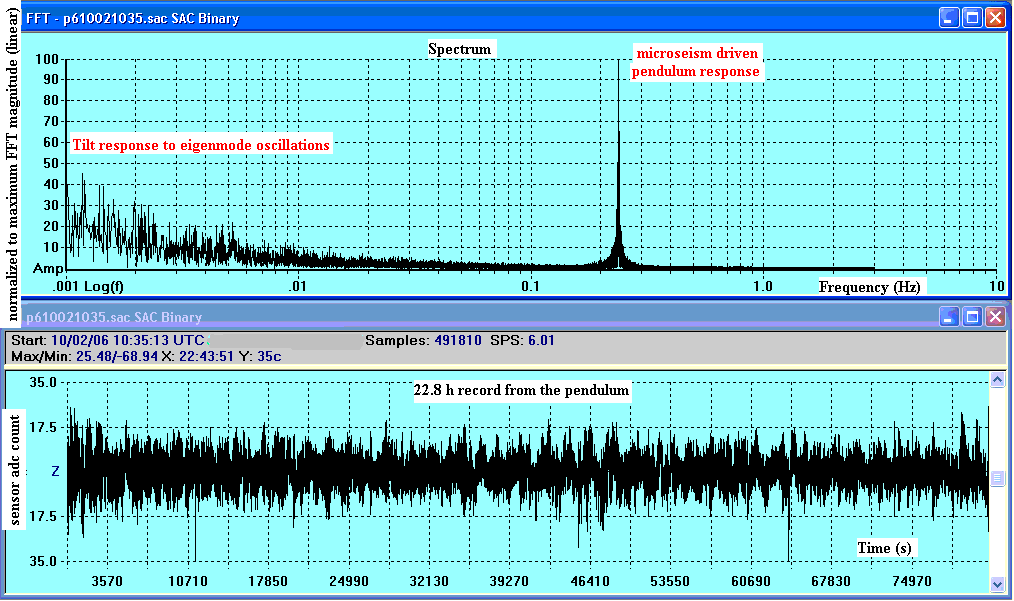
Figure 5. Example pendulum response showing both microseisms and
eigenmode oscillations of the Earth.
Fig. 6 shows a portion of the Fig. 5 record in which the spectrum is plotted in the more common log-log form. The time plot shows clearly how the microseisms rise and fall in time, typically enduring for about 20 cycles.
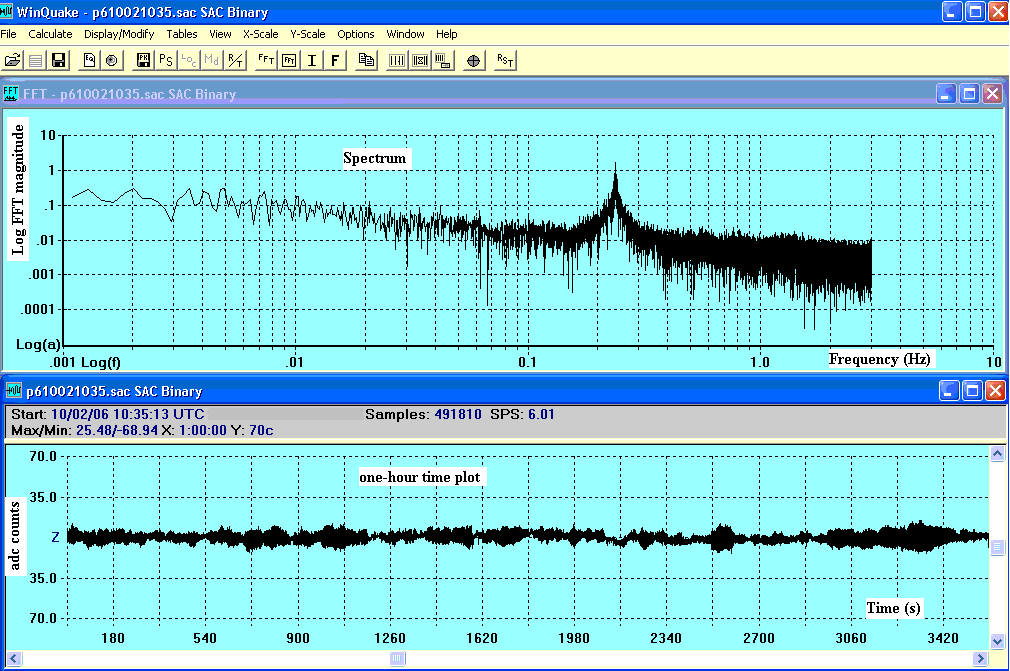
Figure 6. One-hour portion of the Fig. 5 record showing coherence
length (`average' about 20 cycles) of the microseisms.
Figure 7 shows how microseismic activity declined noticeably during a one day interval from 23 September to 24 September 2006. For the plot shown, the record was sharply bandpass filtered around 0.24 Hz.
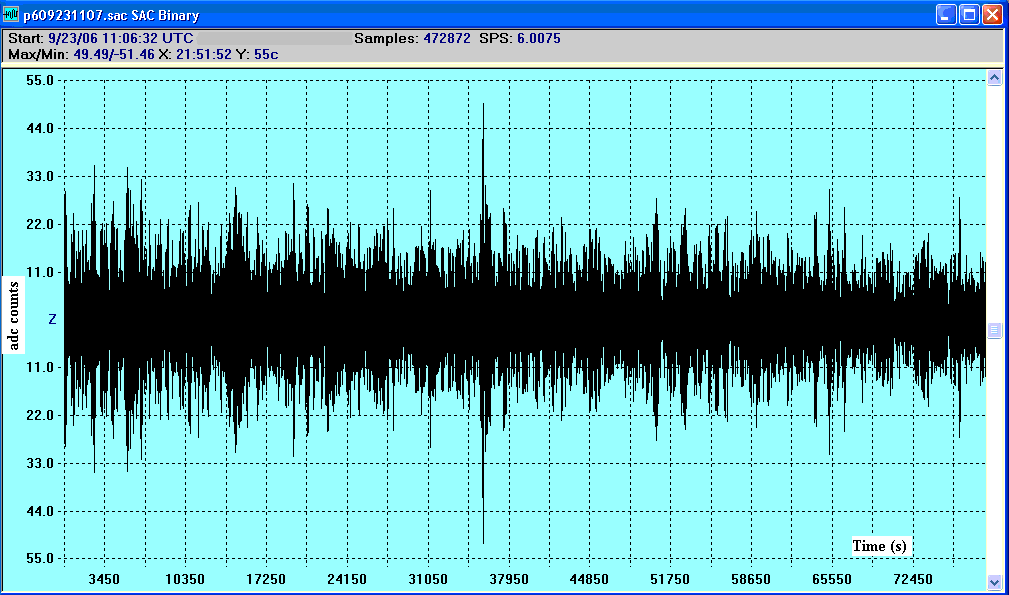
Figure 7. Temporal plot showing the decline in microseismic
activity during a 22 h interval. It was at this time tropical storm
Helene was losing its tropical characteristics in the vicinity of
the Azores.
Bibliography
(1) Symmetric differential capacitance transducer employing
cross coupled
conductive plates to form equipotential pairs, U.S. Patent No.
5,461,319. Online information provided at
http://physics.mercer.edu/petepag/sens.htm
(2) R. Peters, Friction at the mesoscale, Contemporary Physics,
Vol. 45, NO. 6, 475-490 (2004).
(3) R. Peters, ``The Pendulum in the 21st Century-Relic or
Trendsetter'', pp. 19-35 in The Pendulum, Scientific, Historical, Philosophical
& Educational Perspectives, ed. M. R. Matthews, C. F. Gauld, &
A. Stinner, Springer 2005. Online paper at
http://arxiv.org/html/physics/0207001