Computerized Cavendish Balance Experiment
Computerized Cavendish Balance Experiment
Randall D. Peters
Physics Department
Mercer University
Macon, Georgia 31207
Abstract
This document summarizes the basic physics involved in estimating the
Newtonian constant G. It emphasizes the dynamic method in which the
balance is driven at resonance by `swinging the masses' at turning
points of the motion.
1 Background
As shown in the complete manual for the computerized
Cavendish instrument, sold by Tel-Atomic,
Inc.; G is estimated (before corrections to account for non-ideal factors like
boom mass) using the expression:
where M is the mass of each large (perturbing) spherical mass,
m is the mass of each small (boom) mass, d is the distance from the rotation
axis to the center of the small sphere, R is the distance between the
centers of the large and small spheres, and K is the torsion constant
of the 25 mm dia tungsten fiber that supports the boom with its pair of
small masses (refer to Figure 1 of the manual).
The angle qD is determined by the amount of static twist
imparted to the boom,
when the large perturbing masses are `swung' from their `zero' (centered)
position to their maximum displacement (touching the glass plates of the
housing). In moving from zero, the otherwise balanced
boom is disturbed from its static equilibrium starting position qe.
Because the masses are typically swung in roughly 2 s, and because the
period of oscillation of the boom is roughly 250 s, the disturbance
represents essentially a Heaviside step function. The resulting response
of the boom is a simple harmonic free-decay, in which the mean position of
the decay is displaced from the starting position by
the angle qD. If the masses had been swung the opposite direction
by the same amount, then the final displacement (after transient decay)
would be -qD.
2 Free-decay
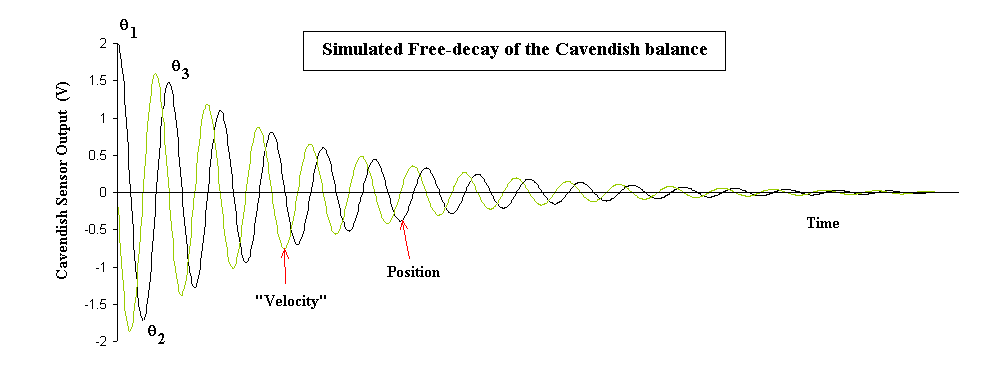
Shown in fig. 1 is an example of free-decay around a mean position
of zero. In practice, oscillation about qe » 0
is almost impossible to achieve, within the measurement
precision attainable with the instrument. Fortunately,
the influence of
non-zero qe can be eliminated from the equations used
to determine qD and thus estimate G. Details are provided in the
manual.
Because of the simpler resulting expressions,
we here assume it to be zero; and nothing of conceptual significance is lost
in so doing.
The example of fig. 1 was generated by modeling the well known case
from classical mechanics,
of a viscous damped simple harmonic oscillator.
Parameters were chosen to approximate the manual case illustrated
in Figure B1. In both that document and the present document, all position
data are expressed in terms of sensor voltage rather than angle in radians.
Because the sensor is essentially linear, the two are proportional
through a calibration constant, with a representative value being
45 V/rad.

Fig. 1 Simulation of a viscous damped simple harmonic oscillator.
The only output from the sensor is a voltage corresponding to
boom position. Also shown in Fig. 1 is a
``velocity'' curve that has been labeled with quotation marks to
draw attention to the fact that it was scaled
in magnitude to yield a curve
of comparable magnitude to the position curve. It is provided to
illustrate phase differences that are important for understanding
how to drive the boom at its resonance frequency (later discussion).
2.1 Damping coefficient
It is necessary to quantify the amount of damping in the instrument, if
the preferred method of measurement is employed. (The reason
for preferring a `dynamic' method instead of a `static' method is discussed
later.)
The damping coefficient b can be determined from any three adjacent
turning points,
such as q1, q2, and q3 shown in fig. 1 as follows:
|
b = - |
2
T
|
ln (- |
q3 - q2
q2 - q1
|
) |
| (2) |
It is worthy of note that eq. (2) is still valid even if qe is
not equal to zero!
Because of measurement errors, accuracy is improved by working with more than
three turning points. The total number N employed must be odd, and
a near-optimum case for the Cavendish balance has been shown to be
N = 11. (Details along with the expression required for using arbitrary N
to determine x = e(-bT/2) are
provided in the manual.)
3 Driving at Resonance
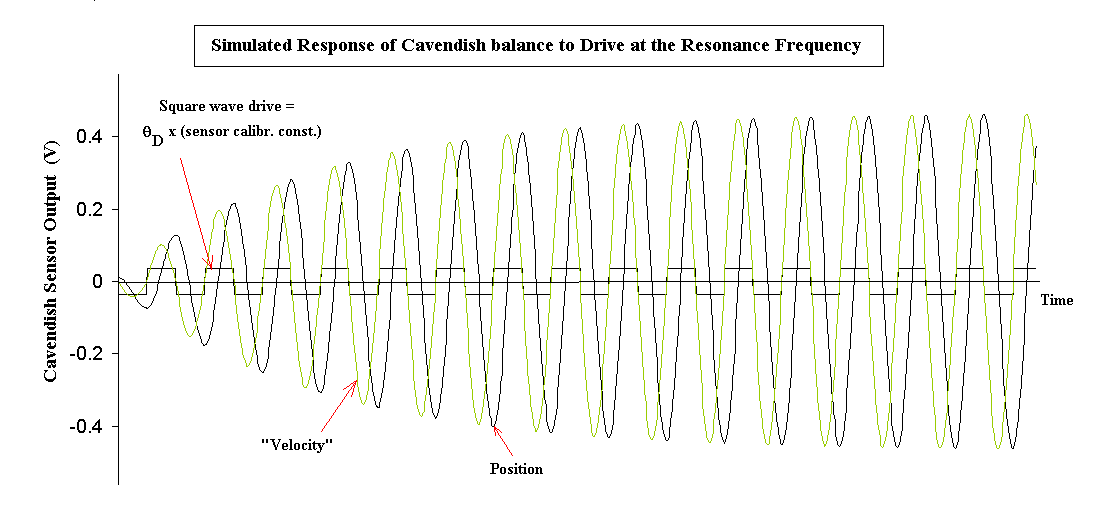
Shown in Fig. 2 is the response of the boom that results for one of the
two possible cases (resonance and antiresonance)-in
which the large
masses are swung at each turning point of the motion. The
square wave (displacement of position) drive is of amplitude qD,
and the oscillatory amplitude is seen
to quickly rise above this static value.
If the mass swings continue without interruption until steady
state is acquired (roughly 20 cycles), then the final amplitude of the
boom motion is 13.3 times qD for the particular case shown
in which bT = 0.30. To drive in this
manner is useful for `magnifying' the influence of the small
gravitational force
between the small and large masses; even if only a small number of swings
are employed. The amount of magnification is determined by the
quality factor Q of the oscillator, which is given by

Fig. 2 Illustration of `magnification' that results from driving
at the resonance frequency.
3.1 Amplitude change per half-cycle
From one half-cycle to the next, the amplitude A builds (for Q >> 0.5)
in accord with the
relationship
If there were no qD drive, the fractional change in the amplitude
per half cycle would just be -(bT/2), consistent with the
exponential decay of fig. 1.
3.2 Steady state
At steady state the energy gained from the drive is just balanced by the
energy lost to friction,
so that the amplitude for this condition is given by
|
Amax = |
4
bT
|
qD = |
4 Q
p
|
qD |
| (5) |
3.3 Phase relationships
It is seen from Fig.2 that resonance results when the fundamental
Fourier component of the square wave drive is in phase with the
velocity, which is equivalent to the addition of a `negative' damping term
to the equation of motion.
This condition is the same as the usual resonance requirement for a harmonic
drive; i.e., the drive
frequency is the same as the oscillator's natural frequency and leads the
oscillator
motion by 90 degrees. It should be noted that we are here ignoring the
damping `redshift', in which frequencies are altered by the viscous
friction. For example, textbooks routinely give the free decay frequency as
where w0® w in the present document.
In actuality the difference between w0 and w1 is
for virtually all oscillators too
small to be measured because of noise. Eq.(1) of the manual retains this
formal difference
for the sake of theoretical completeness; however, one need not employ
the difference in estimating G. For the representative present case
of b = 0.3/(250 s), the damping redshift
is only 0.1%, which is much smaller than the 2% precision possible
with the instrument.
If the phase were instead lagging the motion by 90 degrees,
it would correspond to an antiresonance drive. This would cause the
sign of the 2qD/A term in eq. (4) to be negative,
with a resulting motion that dies out
faster than the free decay case. Accomplished by swinging the masses
180 degrees different in phase from the case shown in Fig. 2, it can
be an effective
means for bringing the balance more quickly to an operational status.
3.4 Observations related to Fourier series
For quality factors significantly greater than critical damping (Q = 0.5)
harmonics present in the drive are inconsequential to the instrument's
response when driven at resonance.
Since the fundamental component of a square wave is 4/p times
the amplitude
of the square wave, one sees that equation (5) is
consistent with the better known case of a harmonic drive; i.e., the
steady state amplitude at resonance in that case is simply Q times the
amplitude of
the drive.
4 Practical Consideration
In practice it is not necessary to drive all the way to
steady state to take advantage of the magnification that results from
resonant `excitation'. If one has the patience to drive for such a
long time, then there is the advantage of a
very simple result ; i.e.,
qD = (bT/4) Amax, where Amax is the steady state
amplitude in radians.
For those with less time and/or patience, the manual provides an
equation (eq. 15) that permits one
to determine qD using any odd number N > 3 of turning points of
the buildup curve corresponding to Fig. 2. As with the free-decay
case, this expression is valid
for non-zero qe, as long as the equilibrium position is constant.
5 Final comment
It should be noted that the resonance drive method for estimating G has
advantages beyond just `magnification'. The tungsten fiber that supports
the boom with its masses is not an ideal Hooke's law torsional element.
In fact, Hooke's law is not to be realized with any real mechanical
oscillator. The `jerky' behavior of real systems, because of the Portevin
LeChatelier effect; causes a variety of difficulties. The mean position
can consequently move about (to include creep). This is cause
for greater complications to a static measurement than
to a dynamic measurement. The relevant
mesoanelastic complexity is too
involved to be presently discussed in detail. It is one of the primary
reasons that G remains the poorest known of the fundamental constants.
For detailed information on how these factors influence damping,
the reader is referred to the
author's contributions (ch. 20 and 21) of CRC's Vibration and Shock
Handbook, ed. Clarence deSilva, 2005.
File translated from TEX by TTH, version 1.95.
On 9 Aug 2005, 08:28.


